This month the SQLskills team is presenting a series of blog posts aimed at helping Accidental/Junior DBAs ‘keep the SQL Server lights on’. It’s a little taster to let you know what we cover in our Immersion Event for The Accidental/Junior DBA, which we present several times each year. You can find all the other posts in this series at http://www.SQLskills.com/help/AccidentalDBA. Enjoy!
Database storage can seem like a black box. A DBA takes care of databases, and those databases often reside somewhere on a SAN – space simply presented to a DBA as a drive letter representing some amount of space. But storage is about more than a drive letter and a few hundred GBs. Yes, having enough space for your database files is important. But I often see clients plan for capacity and not performance, and this can become a problem down the road. As a DBA, you need to ask your storage admin not just for space, but for throughput, and the best way to back up your request is with data.
I/O Data in SQL Server
I’ve mentioned quite a few DMVs in these Accidental DBA posts, and today is no different. If you want to look at I/O from within SQL Server, you want to use the sys.dm_io_virtual_file_stats DMV. Prior to SQL Server 2005 you could get the same information using the fn_virtualfilestats function, so don’t despair if you’re still running SQL Server 2000! Paul has a query that I often use to get file information in his post, How to examine IO subsystem latencies from within SQL Server. The sys.dm_io_virtual_file_stats DMV accepts database_id and file_id as inputs, but if you join over to sys.master_files, you can get information for all your database files. If I run this query against one of my instances, and order by write latency (desc) I get:
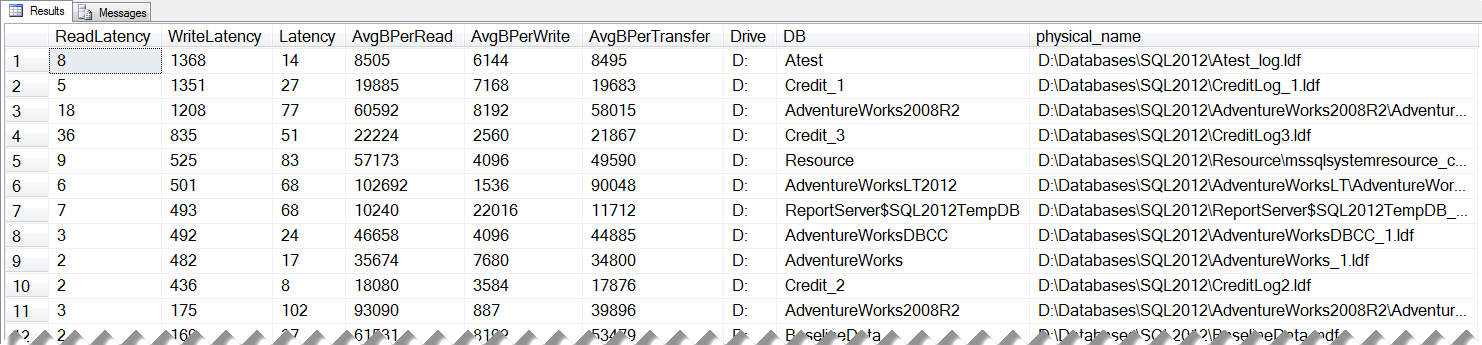
This data makes it look like I have some serious disk issues – a write latency of over 1 second is disheartening, especially considering I have a SSD in my laptop! I include this screenshot because I want to point out that this data is cumulative. It only resets on a restart of the instance. You can initiate large IO operations – such as index rebuilds – against a database that can greatly skew your data, and it may take time for the data to normalize again. Keep this in mind not only when you view the data at a point in time, but when you share findings with other teams. Joe has a great post that talks about this in more detail, Avoid false negatives when comparing sys.dm_io_virtual_file_stats data to perfmon counter data, and the same approach applies to data from storage devices that your SAN administrators may use.
The information in the sys.dm_io_virtual_file_stats DMV is valuable not only because it shows latencies, but also because it tells you what files have the have the highest number of reads and writes and MBs read and written. You can determine which databases (and files) are your heavy hitters and trend that over time to see if it changes and how.
I/O Data in Windows
If you want to capture I/O data from Windows, Performance Monitor is your best bet. I like to look at the following counters for each disk:
- Avg. Disk sec/Read
- Avg. Disk Bytes/Read
- Avg. Disk sec/Write
- Avg. Disk Bytes/Write
Jon talked about PerfMon counters earlier and the aforementioned counters tell you about latency and throughput. Latency is how long it takes for an I/O request, but this can be measured at different points along the layers of a solution. Normally we are concerned with latency as measured from SQL Server. Within Windows, latency is the time from when Windows initiated the I/O request to the completion of the request. As Joe mentioned his post, you may see some variation between what you see for latency from SQL Server versus from Windows.
When we measure latency using Windows Performance Monitor, we look at Avg Disk sec/Read and Avg Disk sec/Write. Disk cache, on a disk, controller card, or a storage system, impact read and write values. Writes are typically written to cache and should complete very quickly. Reads, when not in cache, have to be pulled from disk and that can take longer. While it’s easy to think of latency as being entirely related to disk, it’s not. Remember that we’re really talking about the I/O subsystem, and that includes the entire path from the server itself all the way to the disks and back. That path includes things like HBAs in the server, switches, controllers in the SAN, cache in the SAN and the disks themselves. You can never assume that latency is high because the disks can’t keep up. Sometimes the queue depth setting for the HBAs is too low, or perhaps you have an intermittently bad connection with a failing component like a GBIC (gigabit interface converter) or maybe a bad port card. You have to take the information you have (latency), share it with your storage team, and ask them to investigate. And hopefully you have a savvy storage team that knows to investigate all parts of the path. A picture is worth a thousand words in more complex environments. It often best to draw out, with the storage administrator, the mapping from the OS partition to the SAN LUN or volume. This should generate a discussion about the server, the paths to the SAN and the SAN itself. Remember what matters is getting the I/O to the application. If the IO leaves the disk but gets stuck along the way, that adds to latency. There could be an alternate path available (multi-pathing), but maybe not.
Our throughput, measured by Avg. Disk Bytes/Read and Avg. Disk Bytes/Write, tells us how much data is moving between the server and storage. This is valuable to understand, and often more useful than counting I/Os, because we can use this to understand how much data our disks will be need to be able to read and write to keep up with demand. Ideally you capture this information when the system is optimized – simple things like adding indexes to reduce full table scans can affect the amount of I/O – but often times you will need to just work within the current configuration.
Capturing Baselines
I alluded to baselines when discussing the sys.dm_os_virtual_file_stats DMV, and if you thought I was going to leave it at that then you must not be aware of my love for baselines!
You will want to capture data from SQL Server and Windows to provide throughput data to your storage administrator. You need this data to procure storage on the SAN that will not only give you enough space to accommodate expected database growth, but that will also give you the IOPs and MB/sec your databases require.
Beyond a one-time review of I/O and latency numbers, you should set up a process to capture the data on a regular basis so you can identify if things change and when. You will want to know if a database suddenly starts issuing more IOs (did someone drop an index?) or if the change is I/Os is gradual. And you need to make sure that I/Os are completing in the timeframe that you expect. Remember that a SAN is shared storage, and you don’t always know with whom you’re sharing that storage. If another application with high I/O requirements is placed on the same set of disks, and your latency goes up, you want to be able to pinpoint that change and provide metrics to your SAN administrator that support the change in performance in your databases.
Summary
As a DBA you need to know how your databases perform when it comes to reads and writes, and it’s a great idea to get to know your storage team. It’s also a good idea to understand where your databases really “live” and what other applications share the same storage. When a performance issue comes up, use your baseline data as a starting part, and don’t hesitate to pull in your SAN administrators to get more information. While there’s a lot of data readily available for DBAs to use, you cannot get the entire picture on your own. It may not hurt to buy your storage team some pizza or donuts and make some new friends 🙂 Finally, if you’re interested in digging deeper into the details of SQL Server I/O, I recommend starting with Bob Dorr’s work:
- How It Works: Bob Dorr’s SQL Server I/O Presentation
- SQL Server 2000 I/O Basics (still relevant)
- SQL Server I/O Basics, Chapter 2
Our online training (Pluralsight) courses that can help you with this topic: