CPUID has released a new processor performance and monitoring tool called PerfMonitor 2, which allows you to track four processor-related counters chosen from a processor-specific list. It lets you see things like overall CPU temperature, package and core temperatures, package power usage, L2 and L3 cache hit ratios to name just a few of the items that are visible (depending on your CPU).
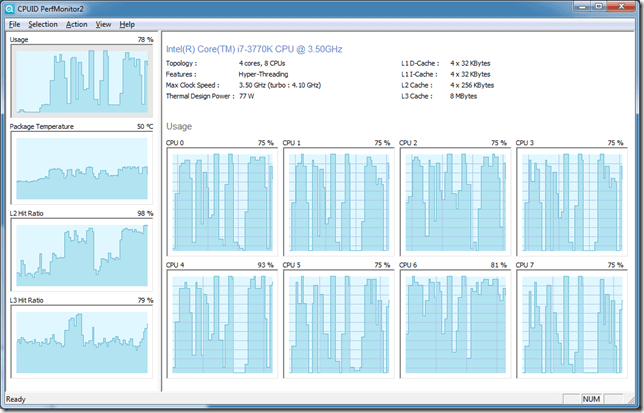
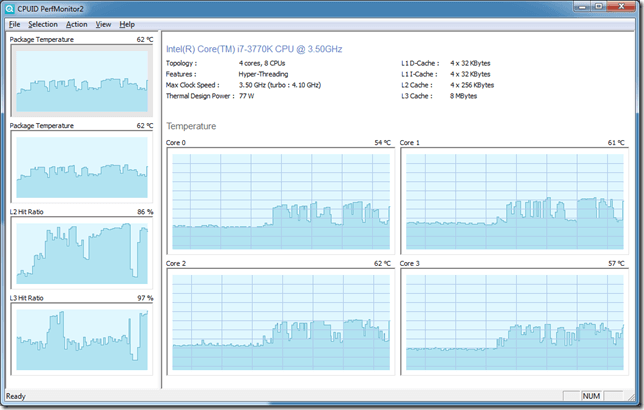
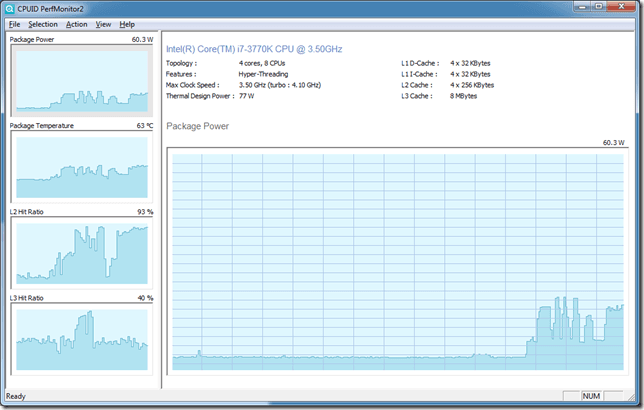
Figures 1, 2, and 3 show some of these counters on my 22nm Intel Core i7-3770K (Ivy Bridge) desktop system, while it was under a load from Geekbench.
Figure 1: Usage Counters
Figure 2: Package Temperature Counters
Figure 3: Package Power Counters
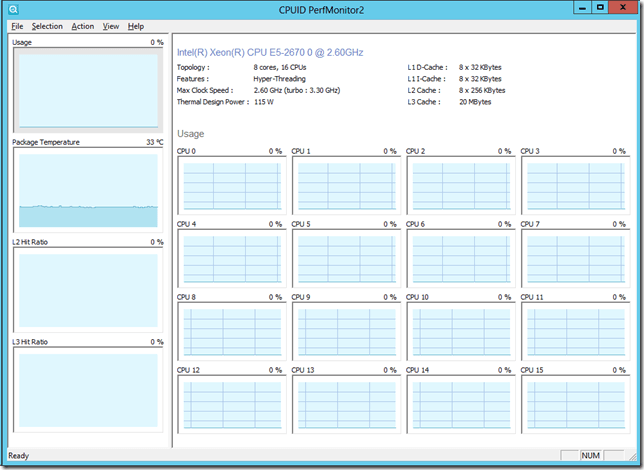
I tried the utility on the Dell PowerEdge R720 system that we have in our SQLskills lab that has two 32nm Intel Xeon E5-2670 (Sandy Bridge-EP) processors, and I noticed that most of the counters showed no data, which was a little disappointing, since both Sandy Bridge and Windows Server 2012 are supposed to be supported.
Figure 4: Blank Counters on Dell PowerEdge R720
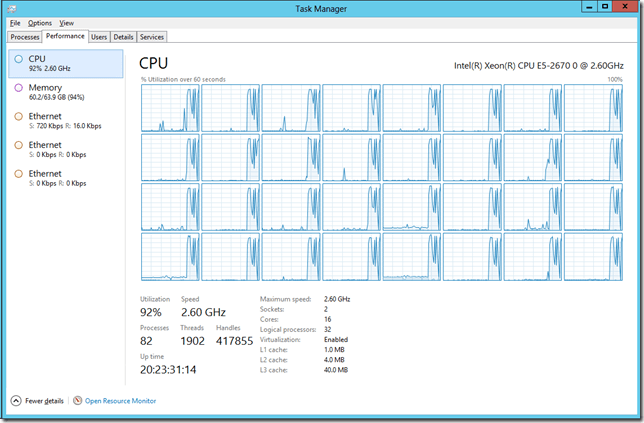
The display looks similar to the Windows Server 2012 Task Manager (shown in Figure 5), which seems to be by design.
Figure 5: Windows Server 2012 Task Manager

