For Day 16 of this series, I am going to talk about a few useful tools you can use to identify some hardware details about a database server. These tools all require that you have access to login to that server, which might be a problem for some people, depending on the policies of their organization. If you are barred from directly accessing your server, my Day 15 post from this series gives you another option to get some information from T-SQL.
The first tool is msinfo32.exe, which is built into all recent versions of Windows. You can simply type msinfo32 in a Run window, and you will see the System Information dialog shown in Figure 1.
Figure1: System Information Dialog
The System Information dialog shows that we have a Dell PowerEdge R720. This dialog also shows that I have two Intel Xeon E5-2670 processors, with 64GB of RAM, running Windows Server 2012 Datacenter Edition.
The second tool is the Computer Properties dialog shown in Figure 2. You can get there by bringing up the Windows Charm with Windows + C, then typing Computer then choosing Computer, right-clicking, and choosing Properties. This shows the version and edition of Windows, the computer name, the processor model, and the amount of installed RAM.
Figure 2: Computer Properties Dialog
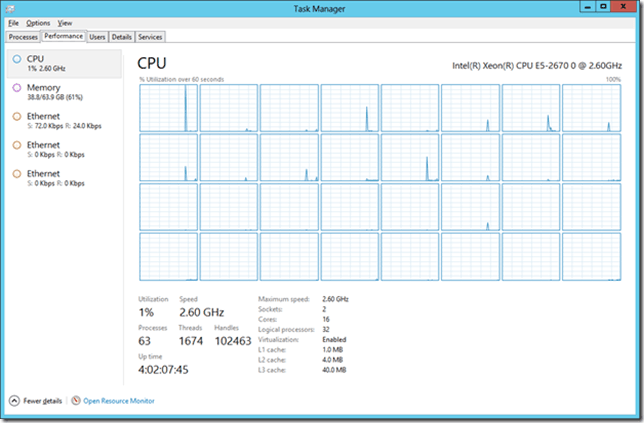
The third tool is Windows Task Manager, which is shown in Figure 3. You can get there by right-clicking on the Task Bar, and choosing Start Task Manager. The Performance tab now has different pages for CPU, Memory, and some other items, depending on your hardware.
The CPU page tells you how many logical processors are visible to Windows (the number of sections you see in CPU Usage History) if you right-click and change the display to show logical processors. You can also see overall CPU usage and CPU usage by NUMA node by selecting the appropriate display type. What is even more useful in Windows Server 2012 is the fact that you see the processor model number and base clock speed, along with the total number of sockets, physical cores, and logical processors. You can also see whether hardware virtualization is enabled, and the cumulative size of your L1, L2, and L3 caches across all of your processors.
Figure 3: Windows Server 2012 Task Manager, Performance Tab, CPU Page
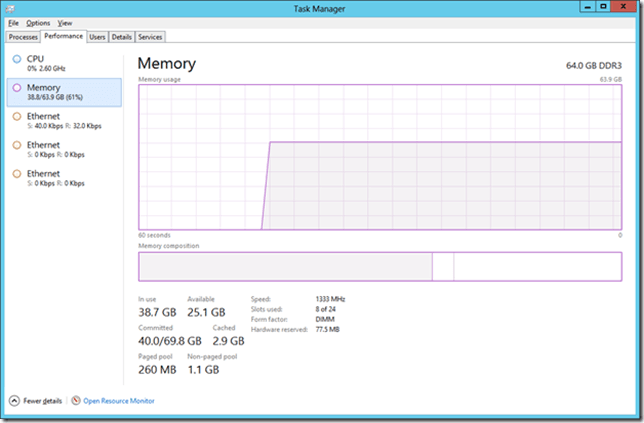
Figure 4 gives you some pretty detailed information about your memory, including the amount of RAM that you have installed, the type and speed of the RAM, and the number of memory slots you have used out of the total number of memory slots in the system. This is all very useful information to know about the system.
Figure 4: Windows Server 2012 Task Manager, Performance Tab, Memory Page


