I’ve recently been creating some content about wait stats analysis and I think it would be really interesting to see what kind of waits people are seeing out there in the wild. Hopefully it’ll also introduce a bunch of people to the waits-and-queues performance troubleshooting methodology and how it can be really useful to them.
[Edit: comments are closed on this post as I have all the info I need – thanks!]
Here’s what I’d like you to do:
-
Run the T-SQL query from the end of this post. It’s completely benign and only reports on statistics that SQL Server is already gathering. It will not cause any perf issues on your production systems.
-
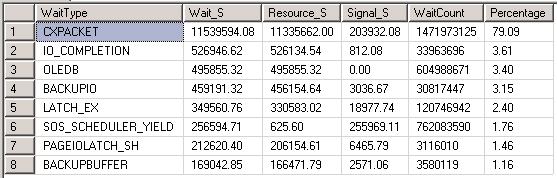
Look at the output – it’ll be something like (from random anonymous client system):
-
Look at the top WaitType and fill in the simple survey below. If your top wait isn’t listed, click on Other and cut-and-paste the top WaitType into the box provided.
The free survey system only allows a single vote per IP address – if you have any other results, send them in email (mailto:paul@SQLskills.com?Subject=Wait stats) or attach a comment below.
In a week or two I’ll report on the results. It would be great to get a few hundred responses.
Thanks!
T-SQL code to run (works on 2005 onwards):
WITH Waits AS
(SELECT
wait_type,
wait_time_ms / 1000.0 AS WaitS,
(wait_time_ms – signal_wait_time_ms) / 1000.0 AS ResourceS,
signal_wait_time_ms / 1000.0 AS SignalS,
waiting_tasks_count AS WaitCount,
100.0 * wait_time_ms / SUM (wait_time_ms) OVER() AS Percentage,
ROW_NUMBER() OVER(ORDER BY wait_time_ms DESC) AS RowNum
FROM sys.dm_os_wait_stats
WHERE wait_type NOT IN (
‘CLR_SEMAPHORE’, ‘LAZYWRITER_SLEEP’, ‘RESOURCE_QUEUE’, ‘SLEEP_TASK’,
‘SLEEP_SYSTEMTASK’, ‘SQLTRACE_BUFFER_FLUSH’, ‘WAITFOR’, ‘LOGMGR_QUEUE’,
‘CHECKPOINT_QUEUE’, ‘REQUEST_FOR_DEADLOCK_SEARCH’, ‘XE_TIMER_EVENT’, ‘BROKER_TO_FLUSH’,
‘BROKER_TASK_STOP’, ‘CLR_MANUAL_EVENT’, ‘CLR_AUTO_EVENT’, ‘DISPATCHER_QUEUE_SEMAPHORE’,
‘FT_IFTS_SCHEDULER_IDLE_WAIT’, ‘XE_DISPATCHER_WAIT’, ‘XE_DISPATCHER_JOIN’, ‘BROKER_EVENTHANDLER’,
‘TRACEWRITE’, ‘FT_IFTSHC_MUTEX’, ‘SQLTRACE_INCREMENTAL_FLUSH_SLEEP’)
)
SELECT
W1.wait_type AS WaitType,
CAST (W1.WaitS AS DECIMAL(14, 2)) AS Wait_S,
CAST (W1.ResourceS AS DECIMAL(14, 2)) AS Resource_S,
CAST (W1.SignalS AS DECIMAL(14, 2)) AS Signal_S,
W1.WaitCount AS WaitCount,
CAST (W1.Percentage AS DECIMAL(4, 2)) AS Percentage
FROM Waits AS W1
INNER JOIN Waits AS W2
ON W2.RowNum <= W1.RowNum
GROUP BY W1.RowNum, W1.wait_type, W1.WaitS, W1.ResourceS, W1.SignalS, W1.WaitCount, W1.Percentage
HAVING SUM (W2.Percentage) – W1.Percentage < 95; — percentage threshold
GO
41 thoughts on “Survey: what is the highest wait on your system?”
I’ve changed maxDOP to 1 on all my servers because CXPACKET was so high, and saw better performance as a result. 75% of my waits are ASYNC_NETWORK_IO. Our app runs client-server over a WAN, I presume this is due to WAN traffic, not saturation of the gigabit adapter(s) on the server…
OLEDB in my case, beating out #2 CXPACKET by a wide margin (36.95% vs 20.57%).
I’ll be very curious to see the final results.
It is interesting that CX_PACKET waits seems to be the early leader.
I wouldn’t be surprised to see that or WRITELOG be the top overall.
CXPACKET would be my guess for the winner. I run across a lot of machines with MAXDOP 0 and huge CXPACKET waits.
Results submitted – for us on our busiest machine it’s MSQL_DQ at 16%- our core enterprise app uses a seven linked server loop to pull data to this reporting server via app-based replication loop
I’m not surprised that CXPACKET is the current top runner. Next runner up on my systems is PAGEIOLATCH_SH, then followed up by OLEDB and IO_COMPLETION.
WRITELOG is just shy of 80% on our OLTP system, which doesn’t surprise me the disks are very slow.
PAGEIOLATCH_SH on the DWH box (just shy of 40%), followed by CXPACKED (just over 30%)
OLEDB for me at 38%. It is a dev system so probably not enough data for CXPacket to be relavent
On the busiest system at my former employer we have:
LATCH_SH = 32%
LATCH_EX = 20%
VIEW_DEFINITION_MUTEX = 12%
OLEDB = 10%
SOS_SCHEDULER_YIELD = 7%
PAGEIOLATCH_SH = 6%
PAGEIOLATCH_EX = 2%
WRITELOG = 1%
Everything else is < 1%
This system is a lot healthier than it was a year ago, when it was 80+% CXPACKET, and most of the rest PAGEIOLATCH_SH.
WaitType Wait_S Resource_S Signal_S WaitCount Percentage
CXPACKET 20601529.03 19992732.62 608796.41 1042103504 73.57
LATCH_EX 5298357.72 4622748.60 675609.12 2098511217 18.92
BACKUPIO 888636.53 887419.98 1216.56 13195939 3.17
We did some test about 6 months ago with some SSD appliances. We found that although lowering the MAXDOP to 1 reduced the CXPacket wait time, the overall performance as measured in query completion times actually decreased with the lower MAXDOP.
ASYNC_NETWORK_IO in my case is the number one wait as this is a DW and Informatica frequently does large data pulls. ASYNC_NETWORK_IO occurs due to the fact that Informatica often can’t keep up with the volume of data headed its way, plus the nature of some of the mappings and the work they do causes the Informatica sources to pause accepting data from SQL Server.
ASYNC_NETWORK_IO – 20.43% is #1. We have ETL processes pulling large volume of data every 20 min.
We’ve been monitoring wait stats for a few months now. CXPACKET was by far the busiest until we set MAXDOP to 1. Now it’s OLEDB averaging 5mil/day & spiking to 10 with end-of-week jobs. PAGEIOLATCH_EX is a close second averaging 6mil/day, rarely spiking. Thus without the eow spikes, PAGEIOLATCH_EX would be highest.
hi!
very surprising to get in my side on all prod servers a first place for PREEMPTIVE_OS_PIPEOPS wait…
looks this wait is linked to xp_cmdshell use or killed connections, but we don’t have that in our standard business activity (around 4000 batch requests/sec)
weird…
PREEMPTIVE_OS_PIPEOPS = 30.36%
CXPACKET = 18.25%
ASYNC_NETWORK_IO = 11.15%
OLEDB = 10.42%
BACKUPBUFFER = 4.81%
…
BROKER_RECEIVE_WAITFOR 3280082.01 3279702.59 379.42 493177 81.21
THREADPOOL 724116.62 724116.44 0.18 1535503 17.93
Stats freshly reset a few hours ago. As you might guess, this server uses service broker heavily, and moreover, there are way too many clients running on it — hence the threadpool wait. We’re just in the process of migrating stuff away, in fact. If I exclude BROKER_RECEIVE_WAITFOR (which is not that interesting as a wait type in itself, as it’s part of normal operations):
THREADPOOL 724051.31 724051.13 0.18 1535421 95.41
Ouch. :-( If I exclude threadpool as well, then (to see what it’s waiting on when it *is* doing useful stuff):
LCK_M_U 6437.20 6424.57 12.63 13967 18.47
LCK_M_S 4923.77 4911.11 12.66 9627 14.13
OLEDB 3919.79 3919.79 0.00 2935529 11.25
MSQL_DQ 3116.06 3116.06 0.00 45132 8.94
SOS_SCHEDULER_YIELD 3114.85 2.58 3112.27 2750912 8.94
PREEMPTIVE_COM_QUERYINTERFACE 2830.22 2830.22 0.00 382923 8.12
PREEMPTIVE_OLEDBOPS 2093.59 2093.59 0.00 15574472 6.01
WRITELOG 1869.01 1288.00 581.01 1045959 5.36
CMEMTHREAD 1748.03 1700.09 47.94 137423 5.02
ASYNC_NETWORK_IO 1683.55 1600.33 83.22 179521 4.83
PREEMPTIVE_OLEDB_GETSCHEMALOCK 784.33 784.33 0.00 43447 2.25
PREEMPTIVE_COM_CREATEACCESSOR 358.48 358.48 0.00 78756 1.03
IO_COMPLETION 266.20 253.15 13.05 294849 0.76
Lots of lock waits, again not unexpected when you’re using service broker heavily.
Seem like I have BACKUPIO as the leading pack…we are backing up the databses to tape with the third party tool…
Great survey idea … maybe would be interesting to segment the answers … business sector, transaction/sec, database size. Concerning the results, I miss a bigger % in LATCH_EX ;-) …
OLEDB – %69.45
LCK_M_X – %20.40
BACKUPIO – %1.79
My Top Three
CXPACKET
PAGEIOLATCH_SH
BACKUPIO-(yuck!!!)
Always those three not necessarily in that order.
Our leaders were BACKUPIO, 32%, and MSQL_XP, 24%; everything else was <= 10%
WaitType Wait_S Resource_S Signal_S WaitCount Percentage
DBMIRRORING_CMD 2617427.86 2616738.22 689.64 6203073 75.70
CXPACKET 385472.33 374082.22 11390.11 27874529 11.15
BACKUPIO 140683.86 136430.42 4253.44 272006659 4.07
PAGEIOLATCH_SH 74264.80 74028.47 236.33 3975223 2.15
MSQL_XP 50204.13 50204.13 0.00 261846 1.45
ASYNC_NETWORK_IO 39511.44 38886.95 624.48 6406939 1.14
For a SQL Server housing SharePoint databases running Standard Edition (64-bit) build 9.00.4273.00 with 44 databases and 905 Gb for Data files and 266Gb for Log files. OS is Windows 2004 with 4 3.16 Ghz Xenon and 64Gv of RAM.
ASYNC_NETWORK_IO 393820.59 307688.44 86132.16 217405321 22.50
PAGEIOLATCH_SH 238932.92 233104.19 5828.73 74450054 13.65
WRITELOG 180694.19 146816.52 33877.67 76189842 10.32
CXPACKET 166034.55 155741.81 10292.73 31414910 9.48
SOS_SCHEDULER_YIELD 130322.47 29.92 130292.55 96707323 7.44
ASYNC_IO_COMPLETION 116239.17 116238.89 0.28 1425 6.64
LCK_M_IS 111529.81 111506.17 23.64 11403 6.37
BACKUPBUFFER 106414.36 104410.36 2004.00 20214408 6.08
LCK_M_X 62125.98 60073.75 2052.23 3465421 3.55
BACKUPIO 48142.67 47395.73 746.94 30544293 2.75
LCK_M_S 38989.98 38383.52 606.47 690546 2.23
PAGELATCH_EX 28212.08 4763.25 23448.83 65791809 1.61
PAGEIOLATCH_EX 27006.13 26535.08 471.05 5579202 1.54
LCK_M_IX 23355.56 23348.41 7.16 11567 1.33
WaitType Wait_S Resource_S Signal_S WaitCount Percentage
DBMIRRORING_CMD 9548221.27 9544839.69 3381.58 25077623 49.46
CXPACKET 2619403.09 2515841.95 103561.14 544739247 13.57
PAGEIOLATCH_SH 2327239.39 2320206.42 7032.97 213694268 12.06
LATCH_EX 854214.13 815822.70 38391.42 430856202 4.42
WaitType Wait_S Resource_S Signal_S WaitCount Percentage
ASYNC_NETWORK_IO 556.45 528.83 27.62 472500 32.80
OLEDB 362.59 362.59 0.00 14860912 21.37
PAGEIOLATCH_SH 179.84 179.60 0.25 45154 10.60
ASYNC_IO_COMPLETION 162.29 162.29 0.00 14 9.57
One is :
WaitType Wait_S Resource_S Signal_S WaitCount Percentage
ONDEMAND_TASK_QUEUE 235623.26 235622.78 0.48 1345 50.25
OLEDB 100262.75 100262.75 0.00 60057771 21.38
BROKER_RECEIVE_WAITFOR 47027.70 47027.44 0.27 1114 10.03
LCK_M_X 18570.51 18570.35 0.17 872 3.96
PREEMPTIVE_OLEDBOPS 10338.27 10338.27 0.00 117119629 2.20
LCK_M_IX 9095.17 9095.12 0.05 264 1.94
ASYNC_NETWORK_IO 6673.88 6602.16 71.73 6002656 1.42
PREEMPTIVE_COM_QUERYINTERFACE 5579.05 5579.05 0.00 2965358 1.19
MSQL_DQ 5456.94 5456.94 0.00 183723 1.16
WRITELOG 4703.50 4614.27 89.23 2369606 1.00
PAGEIOLATCH_SH 4017.63 3979.01 38.61 454299 0.86
The other is :
WaitType Wait_S Resource_S Signal_S WaitCount Percentage
ONDEMAND_TASK_QUEUE 2918029.42 2917641.11 388.31 118904 57.93
PAGEIOLATCH_SH 327290.16 292548.49 34741.68 74536428 6.50
ASYNC_NETWORK_IO 246034.73 239917.20 6117.53 54884797 4.88
BROKER_RECEIVE_WAITFOR 208862.89 208858.77 4.11 1180 4.15
SOS_SCHEDULER_YIELD 180959.81 927.14 180032.68 635622866 3.59
LCK_M_RS_S 173412.34 173367.05 45.29 13585 3.44
WRITELOG 139704.26 133431.99 6272.27 30149399 2.77
CXPACKET 125146.55 117821.27 7325.28 7503097 2.48
PREEMPTIVE_TRANSIMPORT 100423.20 100423.20 0.00 19791039 1.99
LCK_M_IS 92590.53 92583.03 7.50 2223 1.84
LCK_M_X 85258.26 85209.89 48.37 26485 1.69
OLEDB 67908.14 67908.14 0.00 108475108 1.35
PREEMPTIVE_DTC_ENLIST 48140.44 48140.44 0.00 13792174 0.96
PREEMPTIVE_OLEDBOPS 44921.23 44921.23 0.00 1212825430 0.89
LCK_M_IX 35940.54 35930.72 9.82 4735 0.71
Sounds normal :)
But people alway complaint the performance .
On a Production server (large # of databases across 2 disks, 55MB – 300MB data files, most updated weekly):
WaitType Percentage
CXPACKET 58.46
PAGEIOLATCH_SH 14.27
ASYNC_NETWORK_IO 9.46
ASYNC_IO_COMPLETION 5.26
BACKUPBUFFER 5.24
BACKUPIO 1.33
OLEDB 1.22
On a large DataWarehouse system (smaller # of databases, larger DBs have their own disk, Data/Log files on seperate disks, 150MB – 750MB data files, updated daily):
WaitType Percentage
CXPACKET 33.77
PAGEIOLATCH_SH 19.11
IO_COMPLETION 11.43
ASYNC_IO_COMPLETION 8.31
BACKUPBUFFER 8.25
PAGEIOLATCH_EX 5.65
SLEEP_BPOOL_FLUSH 3.36
LCK_M_SCH_S 2.57
BACKUPIO 2.50
OLEDB 2.21
One particular server I’m looking at has OLEDB @ 51% of total wait time, probably because it’s a reporting server that executes complex queries on Oracle using a linked server connection, pulling the data into staging tables.
Mirroring and backups …
DBMIRROR_EVENTS_QUEUE 6283675.74 6281806.52 1869.22 25372072 36.83
DBMIRRORING_CMD 6273338.10 6273056.18 281.92 6269135 36.77
BACKUPIO 1105672.76 1103748.50 1924.25 18857995 6.48
CXPACKET 1012482.04 970756.80 41725.24 325977691 5.93
OLEDB 812394.17 812394.17 0.00 475111757 4.76
LATCH_EX 637597.94 614456.53 23141.42 524173942 3.74
BROKER_RECEIVE_WAITFOR 208001.03 208000.72 0.31 3543 1.22
We have BROKER_RECEIVE_WAITFOR (36.78%) as the top one, the next one is CXPACKET (19.64%).
Our top three: ASYNC_NETWORK_IO = 58.27%, CXPACKET = 23.28%, OLEDB = 4.49% w/ MAXDOP = 2 on eight-core server.
CXPACKET 1091254.78 1044814.74 46440.05 226305871 58.33
ASYNC_NETWORK_IO 238159.73 230834.03 7325.70 207683324 12.73
LATCH_EX 176551.58 151184.28 25367.30 182596547 9.44
(…)
… on a 8-ways EM64T. I’m not surprised either, getting a parallel plan today is cheaper than it did a couple of years ago.
LCK_M_X 3374433.54 3374319.49 114.05 837216 46.41
BACKUPIO 956850.15 954390.75 2459.40 123153316 13.16
PAGEIOLATCH_SH 502953.34 502140.14 813.20 126470806 6.92
BACKUPBUFFER 426203.86 425031.09 1172.77 59461732 5.86
MSQL_XP 374589.91 374589.91 0.00 2925384 5.15
BROKER_RECEIVE_WAITFOR 328951.73 328951.68 0.05 1848 4.52
OLEDB 276388.23 276388.23 0.00 13862193421 3.80
BACKUPTHREAD 143793.67 143761.86 31.81 699686 1.98
ASYNC_IO_COMPLETION 126894.65 126894.46 0.19 1008 1.75
ASYNC_NETWORK_IO 117345.06 113653.27 3691.79 85823218 1.61
PAGEIOLATCH_EX 93523.13 93258.91 264.22 28498849 1.29
WRITELOG 83410.49 80398.05 3012.44 75779170 1.15
IO_COMPLETION 81137.34 78378.21 2759.13 39104962 1.12
LCK_M_IX 79012.59 78968.83 43.76 79470 1.09
From 3 different servers: CXPACKET leads all, #2 different on each.
CXPACKET 1892864.47 1811855.78 81008.69 537964507 29.90
ASYNC_IO_COMPLETION 1021291.81 1021291.72 0.09 3168 16.13
CXPACKET 2123295.77 1867808.36 255487.41 311491236 27.92
BACKUPBUFFER 1644811.78 1644527.91 283.88 15847182 21.63
CXPACKET 4481920.28 4436028.16 45892.13 147006908 54.70
ASYNC_NETWORK_IO 1228307.72 1217487.66 10820.06 219228662 14.99
I’m surprised about the high value of BROKER_RECEIVE_WAITFOR.
WaitType Percentage
ASYNC_NETWORK_IO 60.50
BROKER_RECEIVE_WAITFOR 20.27
BACKUPIO 5.35
ASYNC_IO_COMPLETION 2.56
BACKUPBUFFER 2.50
LCK_M_IX 1.74
BACKUPTHREAD 1.64
PAGEIOLATCH_SH 1.51
CXPACKET 1147999.31 1105236.74 42762.57 221997786 47.86
LATCH_EX 442120.90 412081.49 30039.42 172318656 18.43
LCK_M_S 187326.98 187301.88 25.11 95068 7.81
LCK_M_IX 183177.12 183152.05 25.08 100733 7.64
PAGELATCH_EX 61055.83 49366.35 11689.48 107819029 2.55
WRITELOG 55196.18 54051.00 1145.18 11018892 2.30
SOS_SCHEDULER_YIELD 49730.13 286.66 49443.47 373003150 2.07
LCK_M_SCH_M 39238.05 37010.51 2227.54 4328618 1.64
PAGEIOLATCH_SH 33911.60 33592.86 318.74 4962025 1.41
BACKUPIO 33725.36 33594.04 131.32 3758155 1.41
LCK_M_U 33262.07 33260.69 1.38 22211 1.39
BACKUPBUFFER 20362.21 20068.37 293.84 2744003 0.85
I hope you can comment my results. Best regards!
CXPACKET waits may indicate unbalanced parallelism – you’ll need to check what the threads in your parallel queries are waiting on (those threads not waiting for CXPACKET waits). What are the top latch waits? That’s a little concerning.
SQL2008 R2
WaitType Wait_S Resource_S Signal_S WaitCount Percentage AvgWait_S AvgRes_S AvgSig_S
LATCH_EX 497.37 407.16 90.21 518850 56.58 0.0010 0.0008 0.0002
CXPACKET 240.56 236.25 4.31 22947 27.37 0.0105 0.0103 0.0002
ASYNC_NETWORK_IO 40.28 36.76 3.52 24239 4.58 0.0017 0.0015 0.0001
WRITELOG 32.26 30.49 1.77 12603 3.67 0.0026 0.0024 0.0001
PREEMPTIVE_OS_WAITFORSINGLEOBJECT 29.01 29.01 0.00 8841 3.30 0.0033 0.0033 0.0000
CXPACKET 67708.07 67347.68 360.39 1092003 46.85
ASYNC_IO_COMPLETION 13894.25 13893.90 0.35 4477 9.61
BACKUPBUFFER 12837.18 12809.43 27.75 5757617 8.88
BACKUPIO 11898.23 11843.96 54.27 14207426 8.23
WRITELOG 7917.20 7866.33 50.87 4106475 5.48
PAGEIOLATCH_SH 7218.18 7192.42 25.76 6843039 4.99