I was perusing the release notes for SQL Server 2014 SP2 and found this gem:
Information about enabled trace flags is added to the showplan XML in SQL Server 2014 SP2
Ohhhhhh, very cool. This is great information for troubleshooting!
I fired up my 2014 VM and applied SP2, then verified the trace flags I had enabled for the instance:
DBCC TRACESTATUS;
GO

I have three trace flags enabled, which we typically recommend for all installations*.
So let’s run a few queries and then check the plan. For the first query I’m not adding any other trace flags:
SELECT [p].[ProductID],[p].[StandardCost], [p].[ListPrice], [pi].[Quantity], [p].[Name]
FROM [Production].[Product] [p]
JOIN [Production].[ProductInventory] [pi] ON [p].[ProductID] = [pi].[ProductID]
WHERE [p].[SellEndDate] IS NOT NULL
AND [pi].[Quantity]  < 1000;
GO

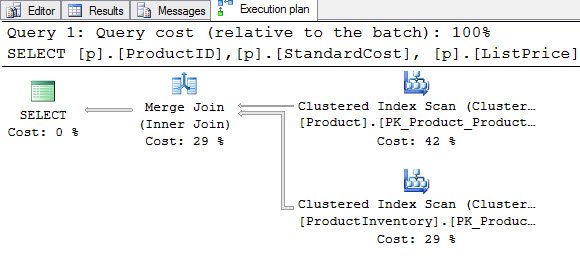
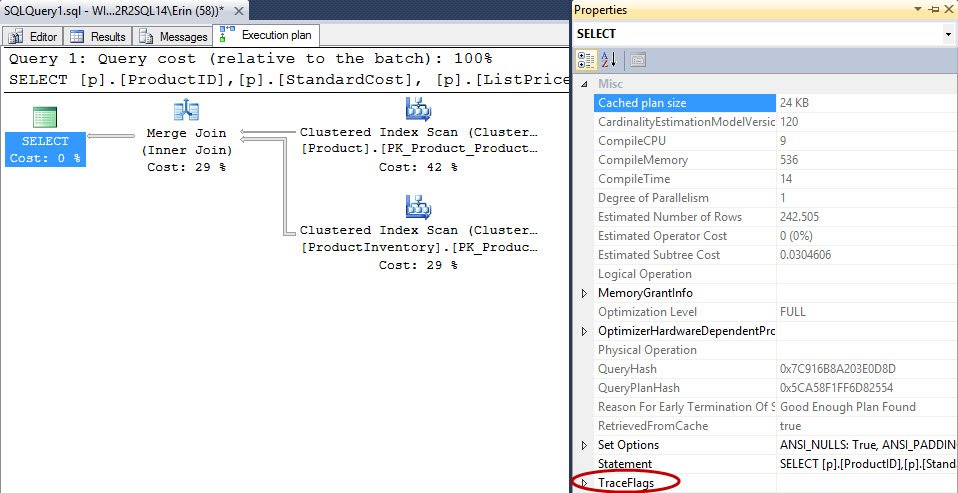
The plan is nothing too crazy – it’s not great because it’s scanning the clustered indexes, but I’m not tuning here so we’ll ignore that for now. But notice that when I click on the SELECT operator with the Properties window open, you’ll see an entry for TraceFlags at the bottom:

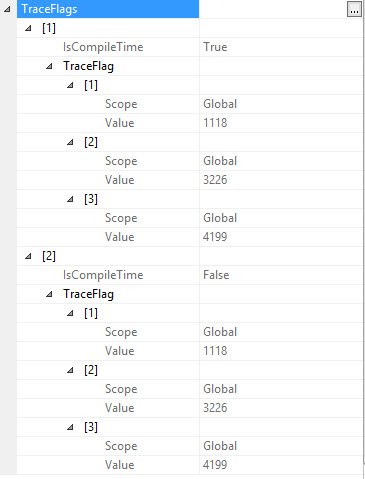
If we expand that, we can see the three trace flags that I have enabled, and it’s noted whether they are enabled globally or locally, and at compile time (IsCompileTime True) and run time (IsCompileTime False):

And I can also go directly to the XML to find the information:

Cool. What happens if I use a trace flag, like 9130 to push out residual predicates into a FILTER operator, in a query hint?
SELECT [p].[ProductID],[p].[StandardCost], [p].[ListPrice], [pi].[Quantity], [p].[Name]
FROM [Production].[Product] [p]
JOIN [Production].[ProductInventory] [pi] ON [p].[ProductID] = [pi].[ProductID]
WHERE [p].[SellEndDate] IS NOT NULL
AND [pi].[Quantity]  < 1000
OPTION (QUERYTRACEON 9130);
GO
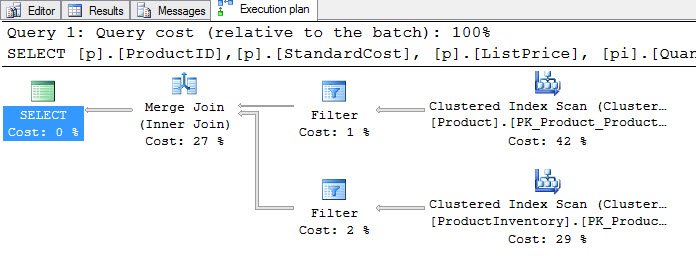
We see the FILTER operators in the plan:

And in the XML we see 9130 for the compilation as a session trace flag, but it doesn’t show up in the execution flags:

Now, in the aforementioned examples, I’ve run the query in Management Studio and captured the actual plan. Do I get all the same information from the plan cache? To check, I’ll clear the plan cache, re-run the most query, and then interrogate the plan cache to see what I get:
DBCC FREEPROCCACHE; /* not for production use! */
GO

SELECT [p].[ProductID],[p].[StandardCost], [p].[ListPrice], [pi].[Quantity], [p].[Name]
FROM [Production].[Product] [p]
JOIN [Production].[ProductInventory] [pi] ON [p].[ProductID] = [pi].[ProductID]
WHERE [p].[SellEndDate] IS NOT NULL
AND [pi].[Quantity]  < 1000
OPTION (QUERYTRACEON 9130);
GO

SET TRANSACTION ISOLATION LEVEL READ UNCOMMITTED;
GO

SELECT [s].[text], [qs].[last_execution_time], [qp].[query_plan]
FROM [sys].[dm_exec_query_stats] [qs]
CROSS APPLY [sys].[dm_exec_query_plan] ([qs].[plan_handle]) qp
CROSS APPLY [sys].[dm_exec_sql_text]([qs].[plan_handle]) [s]
WHERE [s].[text]
LIKE '%SellEndDate%';
GO

SET TRANSACTION ISOLATION LEVEL READ COMMITTED;
GO
When I open the query plan from the output and look at the XML, I see compilation information, but no runtime info:

Presumably, if I run the query again, without clearing the plan cache, and taking off the 9130 trace flag, I would get a new entry:
SELECT [p].[ProductID],[p].[StandardCost], [p].[ListPrice], [pi].[Quantity], [p].[Name]
FROM [Production].[Product] [p]
JOIN [Production].[ProductInventory] [pi] ON [p].[ProductID] = [pi].[ProductID]
WHERE [p].[SellEndDate] IS NOT NULL
AND [pi].[Quantity]  < 1000;
GO

SET TRANSACTION ISOLATION LEVEL READ UNCOMMITTED;
GO

SELECT [s].[text], [qs].[last_execution_time], [qp].[query_plan]
FROM [sys].[dm_exec_query_stats] [qs]
CROSS APPLY [sys].[dm_exec_query_plan] ([qs].[plan_handle]) qp
CROSS APPLY [sys].[dm_exec_sql_text]([qs].[plan_handle]) [s]
WHERE [s].[text]
LIKE '%SellEndDate%';
GO

SET TRANSACTION ISOLATION LEVEL READ COMMITTED;
GO

True. When I check the plan for the second entry, with the later execution time, in the XML I find:

Ok, so I can find what trace flags are enabled when a query is compiled, and if anyone is using QUERYTRACEON to enable trace flags, I can see that here as well. (If you’re wondering, yes, I could see also see that from querying the plan cache because it’s in the text of the query.) On a bigger scale, I can mine the plan cache for this information. HUGE thanks to Jonathan for saving me from a losing battle with XQuery:
SET TRANSACTION ISOLATION LEVEL READ UNCOMMITTED;
GO

WITH XMLNAMESPACES
(DEFAULT 'http://schemas.microsoft.com/sqlserver/2004/07/showplan')
SELECT
STUFF((SELECT ', ' +  tf.value('(./@Value)[1]', 'varchar(10)')
FROM stmt.nodes('./QueryPlan/TraceFlags[@IsCompileTime="1"]/TraceFlag[@Scope="Global"]') AS t(tf)
FOR XML PATH('')
), 1, 2, '') AS GlobalTraceFlags,
STUFF((SELECT ', ' +  tf.value('(./@Value)[1]', 'varchar(10)')
FROM stmt.nodes('./QueryPlan/TraceFlags[@IsCompileTime="1"]/TraceFlag[@Scope="Session"]') AS t(tf)
FOR XML PATH('')
), 1, 2, '') AS SessionTraceFlags,
stmt.query('.') as stmt_node,
cp.usecounts,
qp.query_plan,
cp.plan_handle,
qp.objectid,
cp.objtype,
cp.cacheobjtype,
cp.size_in_bytes
FROM sys.dm_exec_cached_plans AS cp
CROSS APPLY sys.dm_exec_query_plan(plan_handle) AS qp
CROSS APPLY query_plan.nodes('/ShowPlanXML/BatchSequence/Batch/Statements/StmtSimple') AS batch(stmt)
WHERE stmt.exist('./QueryPlan/TraceFlags[@IsCompileTime="1"]') = 1
OPTION(RECOMPILE, MAXDOP 1);

Awesome…Jon’s code breaks out global and session trace flags from the query plan, which makes it easy to find any session level flags in use. Note that this query will return the entire plan cache, so I recommend including additional predicates in the WHERE clause (e.g. where the session flag is NOT NULL).
*Why we recommend 3226 and 1118:
Fed up with BACKUP success messages bloating your error logs?
*Note that 4199 is no longer needed in SQL Server 2016 if you’re using database compatibility mode 130, see SQL Server query optimizer hotfix trace flag 4199 servicing model.
