This post is a continuation of the SQL Server 2014 Cardinality Estimator enhancements exploration series (yeah – I’ve decided to call this a series, since there will be quite a bit to talk about, time permitting):
- A first look at the query_optimizer_estimate_cardinality XE event
- “CSelCalcCombineFilters_ExponentialBackoff” Calculator
- “CSelCalcCombineFilters_ExponentialBackoff” Calculator– Part II
So for this post, I created a nonclustered index on the charge_dt column from the charge table in the Credit sample database and then inserted 10 new rows as follows:
INSERT INTO [dbo].[charge]
([member_no]
,[provider_no]
,[category_no]
,[charge_dt]
,[charge_amt]
,[statement_no]
,[charge_code])
SELECT TOP 10 [member_no]
,[provider_no]
,[category_no]
,GETDATE()
,[charge_amt]
,[statement_no]
,[charge_code]
FROM dbo.charge
GO
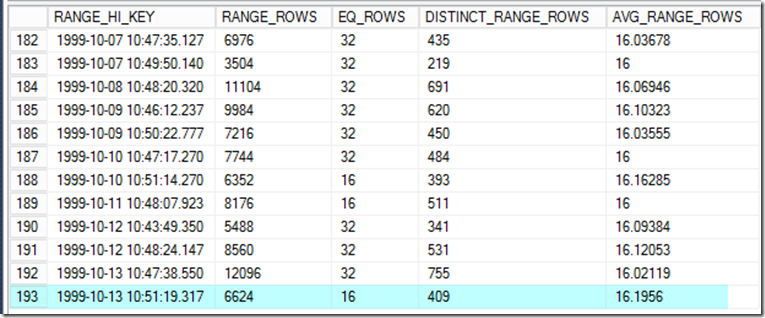
Notice I’m using GETDATE() for the charge_dt, and if you look at the last few rows of the histogram for charge_dt you’ll see that nothing in the year 2013 is represented (and I’m only inserting 10 new rows, and haven’t manually update statistics recently):
In SQL Server 2012, what row estimate would you expect if I executed the following query?
SELECT [charge_no]
FROM dbo.[charge]
WHERE [charge_dt] = ‘2013-11-17 12:46:44.307’
OPTION (RECOMPILE);
In this case, the plan tree (via SQL Sentry Plan Explorer) is as follows:
The estimate is for 1 row (actual is 10 rows).
What are my estimates if I switch the database to compatibility mode 120 and re-execute the same exact query?
In 2014 CTP2 – my estimate is for 10 rows, and re-checking the histogram, the maximum RANGE_HI_KEY is still 1999-10-13 10:51:19.317 and not a more recent value.
What does the query_optimizer_estimate_cardinality event show?
<CalculatorList>
<FilterCalculator CalculatorName=”CSelCalcColumnInInterval” Selectivity=”-1.000″
CalculatorFailed=”true” TableName=”[Credit].[dbo].[charge]” ColumnName=”charge_dt” /><FilterCalculator CalculatorName=”CSelCalcAscendingKeyFilter” Selectivity=”0.000″
TableName=”[Credit].[dbo].[charge]” ColumnName=”charge_dt” UseAverageFrequency=”true” StatId=”7″ />
</CalculatorList>
I highlighted a couple of interesting areas – including the CalculatorFailed=”true” associated with CSelCalcColumnInInterval and then what seems to be the application of a second calculator, CSelCalcAscendingKeyFilter – which implies I would assume something related to the classic ascending key issue and a “true” for “UseAverageFrequency”.
If this is average frequency, then we’re looking at density times the row count, which would mean 1,600,010 rows times the 1.006087E-05 density from the that particular statistics object:
However if you do that calculation, you’ll get 16.0974926087 instead of the 10 row estimate.
Looking further in the query_optimizer_estimate_cardinality output (still associated with the prior calculator) I see the following:
<StatsCollection Name=”CStCollFilter” Id=”2″ Card=”10.00″>
<LoadedStats>
<StatsInfo DbId=”6″ ObjectId=”229575856″ StatsId=”7″ />
</LoadedStats>
</StatsCollection>
Continuing the search, I loaded 90 more rows with that same ‘2013-11-17 12:46:44.307’ value and re-executed the query to see the query_optimizer_estimate_cardinality event information.
This time the estimates bumped up as follows (16 rows instead of a 10 row estimate, with 100 actual rows):
There was still no change to the statistics (no additional step for the year 2013 data).
As for query_optimizer_estimate_cardinality event information, I saw the following:
<CalculatorList>
<FilterCalculator CalculatorName=”CSelCalcColumnInInterval” Selectivity=”-1.000″ CalculatorFailed=”true” TableName=”[Credit].[dbo].[charge]” ColumnName=”charge_dt” />
<FilterCalculator CalculatorName=”CSelCalcAscendingKeyFilter” Selectivity=”0.000″ TableName=”[Credit].[dbo].[charge]” ColumnName=”charge_dt” UseAverageFrequency=”true” StatId=”7″ />
</CalculatorList>
<StatsCollection Name=”CStCollFilter” Id=”2″ Card=”16.10“>
<LoadedStats>
<StatsInfo DbId=”6″ ObjectId=”229575856″ StatsId=”7” />
</LoadedStats>
</StatsCollection>
The 16.10 reflects what the average frequency value was that I expected (16.0974926087 rounded up). But regarding the original 10 estimate, I wondered what would happen if I deleted 99 out of the 100 rows with the 2013 value. Would I still see a Card=”10.00” or something else?
This is what I saw:
The estimate was for 16 rows again – with 1 actual row returned.
Then I thought about reverting to the beginning of my test – restoring from backup to the vanilla version of the Credit database and then flipping it to 2014 mode again. I did this, re-created the index on charge_dt and then re-ran the initial 10 row insert and follow-up query against the 2013 date value that didn’t exist as a histogram step. I was able to repeat the 10 row estimate effect.
I also tried a re-set of the test with just 2 rows initially inserted and got the estimate of 2 rows and Card=”2.00” for the stats_collection output for query_optimizer_estimate_cardinality. Same thing if I did 15 rows (got a 15 row estimate). Doing 16 rows, the same – estimating 16 instead of 16.10.
And when I reset the test with 17 rows (which is above the average frequency), the estimate used is the average frequency of 16.10 and not 17. Interesting!
Much more to explore on this overall subject.


