Blog posts in this series:
-
For the hardware setup I'm using, see this post.
-
For an explanation of log growth and its effect on perf, see this post.
-
For the baseline performance measurements for this benchmark, see this post.
-
For the increasing performance through log file IO optimization, see this post.
-
For the increasing performance through separation of data and log files, see this post.
In the previous post in the series, I examined the effects of separating the data and log files (one file each) to different RAID arrays. It was very obvious that separation gave a performance boost, and that having the portion of the database with the highest I/O write throughput requirements on the faster array (the 8-drive 15k SCSI RAID10) produced the biggest gain.
Now – a confession. In the last post, when I posted it I found that moving the data an 8-drive 7.2k SATA RAID10 array was the best approach. *But* during the testing for this post, I found that one of my tests had screwed up and only half the client threads had run. You'll notice in that post I went back in and edited it to explain that and update the graph and results. I've now augmented my test harness with a way to check that all client threads are running – to make sure the tests are apples to apples, rather than apples to pomegranates :-)
So – the best I've been able to do so far with the tests is creating 1TB of data using 128 connections (each creating 1/128th TB using inserts with default values) with the single data file on an 8-drive 15k SCSI RAID array (pre-created to 1TB) and the log file on an 8-drive 7.2k SATA RAID10 array (pre-created to 256MB with 50MB autogrowth) in 20842 seconds.
Lots of people have been asking how my network is setup in these tests. Here's what I've been running with (all 1GB ethernet):
-
1 NIC from a Broadcom BCM5708C NetXtreme II GigE card on the 10.x.x.x network
-
1 NIC from a Broadcom BCM5708C NetXtreme II GigE card on the 192.168.x.x network
-
2 x PowerConnect 5424 24-port iSCSI optimized switches , with no separation of traffic
-
The 10.x.x.x server NIC connected to all iSCSI arrays
Over the last couple of weeks I've been playing around with the network setup to make sure things are optimized, and this post will describe what I did and what effect it had. In all the tests below, I kept the dat aon the faster SCSI array and the log on the slower SATA array.
I'm very grateful to the help I received from Wes Brown (twitter|blog) and Denny Cherry (twitter|blog) to the technical questions and WTF?s I sent (and to anyone else on twitter I may have forgotten!).
1) Separation of network traffic
I decided to make one of the 5424 switches dedicated to iSCSI traffic on the 10.x.x.x network and the other for general network activity, including connecting to the management ports on the MD3000s. Turns out that I didn't really need to, as each 5424 can handle 48GB of throughput, way more than I'm generating. But hey ho, at least the wiring in the back of the 42U rack is a little tidier now :-)
Running the 128-way test with the new configuration gave a test time of 21252 seconds, slightly slower than the best time without separation! This was the first of the WTF?s. Until I realized that I hadn't actually removed any network bottleneck at all. I can't explain why things are slightly slower here, so I decided to take the switches out of the equation. My suspicion is that if I ran the test ten times, I'd get ten different results, but within a standard deviation of the median. So – no cause for concern. (In fact, I'm going to try this as part of the next set of tests.)
2) Direct connections to the iSCSI arrays
I configured another NIC (one from an Intel PRO/1000 PT Dual Port GigE card) and then had one NIC directly connected to one of the RAID controllers on the SCSI MD3000 (only one configured volume, so no concerns about having multiple volumes suddenly switching over to a non-optimal RAID controller) and the other NIC directly connected to the SATA MD3000.
Running the 128-way test with the new configuration gave a test time of 21859 seconds, slower than test #1. Very surprising – I expected to get some *gain* so I looked at the peak throughput of the arrays:
- For test 1, peak SATA was 50500 bytes/sec and peak SCSI was 106012 bytes/sec.
- For test 2, peak SATA was 46923 bytes/sec and peak SCSI was 107708 bytes/sec.
Things are slower with the network bottleneck removed.
3) Upgrading 5424 switch firmware and reconfiguring
Although the 5424 switches are supposed to come iSCSI optimized, I thought I'd flatten them and reconfigure the. I got the latest version of the switch firmware and re-flashed both switches. I think configured the 10.x.x.x one specifically for iSCSI using this excellent Dell whitepaper.
Running the 128-way test with the new configuration gave a test time of 20745 seconds. Finally an improvement, but nothing major, and still possibly just a statistical variation.
4) Upgrading the NIC drivers
Next I figured I'd bring the NICs up to the latest driver versions so upgraded all the NICs on all the servers.
Running the 128-way test with the new configuration gave a test time of 21743 seconds. Hmmm.
5) Homogenizing the network paths
At this point I started wondering if the Broadcom and Intel NICs had different characteristics so I decided to use the two Intel NICs for the iSCSI traffic. I also enabled jumbo frames. The Intel NICs have three setting for jumbo frames – off, 4088 bytes or 9014 bytes. The MD3000s can only go up to 9000 bytes, so I chose 4088 bytes and configured the MD3000 iSCSI ports to use the same.
Running the 128-way test with the new configuration gave a test time of 21526 seconds – nothing to write home about.
None of the network configuration changes I made had much effect on performance, apart from removing the network bottleneck, which made performance slightly worse overall. I checked other stuff like TCP offloading, but that wasn't enabled. My suspicion was that by removing the network bottleneck, I unmasked a SQL Server contention issue with my 128-connection test. I decided to try fewer client connections.
Here are the results:
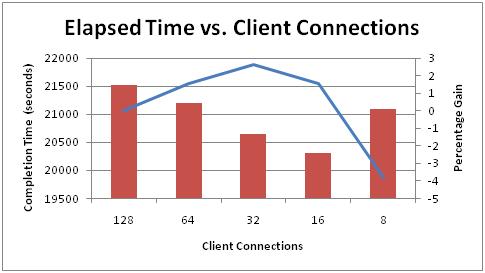
There's clearly a SQL Server bottleneck that's being alleviated by reducing the number of connections and allowing the throughput to each array to increase slightly. With 8 connections, SQL Server isn't being driven hard enough and the elapsed time increases again, and this is reflected in the array throughput measurements too (a 10-15% drop compared to the 16-way test). One thing I forgot to do was examine the distribution of wait types while these tests were running, but my guess would be the bottleneck was in the transaction log manager.
Summary
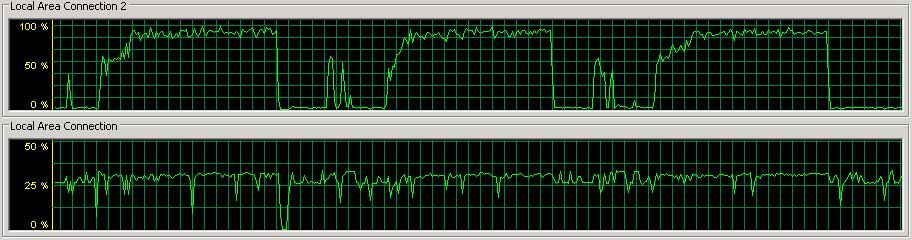
By separating the network traffic and moving to two iSCSI NICs, I removed the network bottleneck I had (see the image at the bottom of the last post) and replaced it with a SQL Server bottleneck. Here's a snapshot of network utilization with the new setup:
In the next set of tests, I'm going to look at the effect of altering the transaction log auto-growth size, and pre-allocation size. In all the tests so far, the log has grown from the pre-allocated 256MB to somewhere between 6.5-8GB.
Should be interesting – stay tuned.
PS Yes, I'll be doing a bunch of stuff with the Fusion-io drives too – be patient! :-)
6 thoughts on “Benchmarking: 1-TB table population (part 4: network optimization)”
I bet you will see a huge improvement if you preallocate the log file to something like 2GB. You can also try lots of different configurations and settings more quickly if you just generate say 100GB just to see if the change works like you expect, instead of waiting 21000 seconds for each iteration to complete. Then you can rerun the full test for more interesting configurations.
Keep up the interesting posts!
@Konstantin All good points – but you’re jumping the gun a little. I’m taking it one step at a time and I want to keep the configuration something I’d do in production, so I won’t touch RAID0. Once I get multiple data files on separate RAID arrays I can have a server NIC talking to each array, and splitting out everything else onto faster drives is part of the process. It’ll take some time and more posts to get there though.
I don’t agree that you completelly removed the network bottleneck (that’s why new results withing satistical variation from each other). Look, network utilization is almost 100% for the data disk array during checkpoints, and pick throughtput also is around 100Mb/sec, that’s the top for the 1Gb network. What you did is that you split IO operations for the system, i.e. data array for the test is primarily massive writes during checkpiints and require as much write throughtput from the system as possible, you still tap 100Mb/sec for all tests during checkpoints. Now, another array holds t-logs which require as fast as possible commit operations as possible (I remember, while at Microsoft, I heard that SQL log writer has internal throuttle mechanism that would scale back log writes in case of a slow IO subsysten by bringing some atrificial internal latencies, never was able to confirm that, so maybe you have more inforamtion in that regard). You don’t see throughput problem for the SATA array (network utilization is withinh 25%), but 7.2K drives are a lot more slower from the latency point than 15K drives and that probably is a part of the problem for tests you are running, there’s a Perfmon IO counter – sec/write – it would be interesting to see it’s reading for the SATA array during the tests.
Now here’s a proposal for another test that may improve IO profile for the system:
– Data array: behind 2 Network cards configured with round-robin MPIO (to increase pick throughtput to 200MB/sec) with 2/3/4 15K SAS HDDs configured in RAID0 (it’s not redundant I know, but these are throwaway tests anyway)
– Log array: behind 1 Network card (different from data array netwrok cards) with 1/2 15K SAS HDDs, and possibly Fusion-IO drives, to improve write latency.
I may have missed the bit where you explain how the client system(s) running the connections that are loading the data are configured. I’d be surprised if you had 128 client systems each running one connection so at a guess that means you have a smaller number of systems running multiple connections.
How do you know that the client systems are not part of the bottleneck?
Craig – the explanation and code is in parts one and two – it’s 128 SQLCMD connections to the SQL instance, all running on the same Win2k8 server, but all the code is server-side – there’s no network traffic.
Paul, thanks for the clarification. I guess I was reading too much into the statement:
Varying numbers of concurrent connections (16, 32, 64, 128, 256) to the server (8-way DELL PowerEdge 1950)