I'm running some performance tests on the hardware we have (more details on the first of these tomorrow) and I was surprised to see some explosive transaction log growth while running in the SIMPLE recovery model with single row insert transactions!
Without spoiling tomorrow's thunder too much, I've got a setup with varying numbers of connections populating a 1TB table with default values, with the single data and log files on the same 8-drive RAID-10 array (again more details on why tomorrow). I was looking at perfmon while the test was running with 128 concurrent connections, and noticed some weird-looking behavior – basically what looked like a never-ending checkpoint occuring. So I dug in deeper and discovered the transaction log had grown over 7GB since the start of the test. Huh?
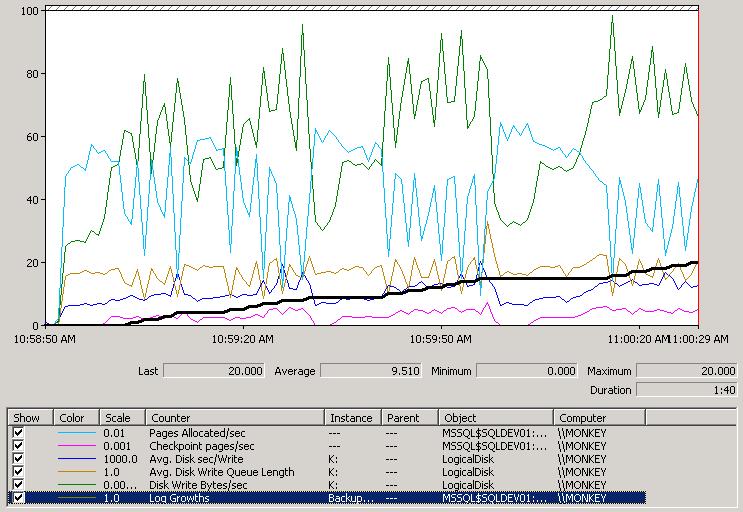
I restarted the test from scratch, with a 1TB data file and a 256MB log and watched what happened in perfmon; here's the screenshot of the first 90 seconds:
Check It Out!
SQL Server Jumpstart+ Bundle
$4,070.00 Original price was: $4,070.00.$999.00Current price is: $999.00.

This is *so* interesting. The black line is the number of log growths, so you can see the log grows every time the line level goes up. The bright blue line is the number of pages being allocated per second to hold all the table rows my 128 connections are inserting. You can clearly see that every time there's a log growth, the allocations take a nose-dive – because no transactions can commit while the new portion of the log is being zeroed (remember that instant file initialization does not apply to the log – see this blog post). The green line (disk write bytes per second) spikes when the log grows because of the zeroes being written out to the log file by SQL Server (remember that SQL Server does the zeroing).
But why is the log growing in the first place? I'm in the SIMPLE recovery model and doing single-row implicit transactions (yes, I'm deliberately doing this) so there shouldn't be anything stopping the log from clearing during a checkpoint, right?
Wrong. The log starts out small (256MB) so one of the thresholds for triggering a checkpoint gets hit pretty fast (70% of the log file is used). So a checkpoint occurs (you can see the checkpoints occuring when the pink line at the bottom of the perfmon screen is above zero), and starts writing out to the data file, which is on the same disk as the log (see How do checkpoints work and what gets logged for an explanation of checkpoint mechanics), but it can't write fast enough (because of disk contention) to get to the log-clearing part before the log fills up completely and has to grow (because transactions are continuing at break-neck speed). So the log grows, and the insert transactions stop while the log is zeroed. And then the log starts to fill up again very quickly and another checkpoint is triggered, and so on and so on.
Eventually a steady state is reached where there's enough free log space during a checkpoint that no new log is required for the concurrent transactions to commit. You might ask why the checkpoint is so slow in the first place? Because I deliberately put the data file on the same RAID array as the log file, and both are being steadily hammered with writes – classic disk contention. Even though the RAID array is RAID-10 with 8x300GB 15k SCSI drives, the average disk queue write length is over 20 most of the time during the 128-way test because I'm simply trying to do too much.
The point of my blog post? Just because you don't have any of the classic causes of transaction log growth going on, doesn't mean you're going to be immune. In this case my (deliberate) poor physical layout of the database files and workload growth up to 128 concurrent connections caused the log to grow. What started out working when I was running 16 connections didn't work any more at 128 (actually I went back and re-ran some of the earlier tests and even with only 64 connections, the log grew to over 1GB before reaching steady-state).
Interesting eh?
Tomorrow I'll be continuing the perf/benchmarking series by creating my first benchmark and then tweaking the setup to see how I can improve performance (for instance with multiple data files, separation of log and data files – all the things I preach but have never *demonstrated*), but this behavior merited a post all on its own.


4 thoughts on “Interesting case of watching log file growth during a perf test”
Paul, Great post I’m currently trying to run as many writes per/Sec In a similar goal to find different performance increases. I am using a Fusion SSD card though so that I can maximize my writes/reads since I don’t have the extra hardware to use. I look forward to the different steps your going to take as It’s really going to help me in my testing! Thanks!
pat
Thanks Paul
Very interesting and insightful!
Another situation where you can see very rapid transaction log growth while in Simple Recovery model is when you do something like loading a large table with an INSERT INTO … SELECT FROM pattern. Using SQL 2008, along with a TABLOCK on the destination table along with a trace flag can get you minimal logging, but otherwise very fast log growth unless you have pre-sized the log file to be big enough.
I’m sure you know all this, but it seems like good fodder for some experiments in your lab and blog posts.
Great little write up of a really important topic; as expected on this site!
:)