Blog posts in this series:
-
For the hardware setup I'm using, see this post.
-
For an explanation of log growth and its effect on perf, see this post.
-
For the baseline performance measurements for this benchmark, see this post.
-
For the increasing performance through log file IO optimization, see this post.
-
For the increasing performance through separation of data and log files, see this post.
-
For my first (mostly unsuccessful) crack at network optimization, see this post.
The saga continues. Like a bad Star Wars prequel. But with better special effects and more believable dialog.
In the previous post in the series I messed around the network configurations – well, really I flailed a bit as it's not my specialty – and you can't run DBCC CHECKNETWORK with a REPAIR_MAKE_IT_FASTER switch.
The net effect of my flailing was no real increase in my benchmark performance. I managed to shave off a few hundred seconds from a 5.5 hour run-time. The best I could get for generating my 1-TB clustered index was 20317 seconds with the following being a picture of typical network utilization:
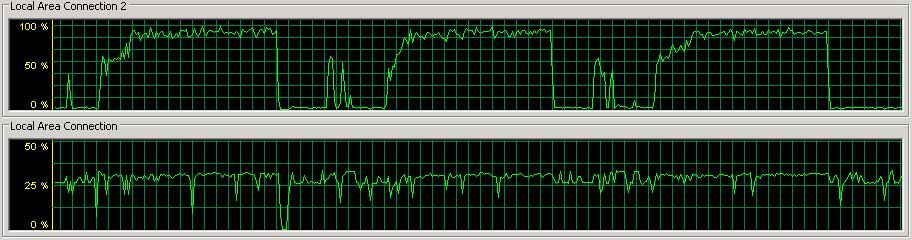
There's clearly a bottleneck there when the iSCSI NIC to the data array hits 100% utilization – when a checkpoint is occurring. I resolved myself to figuring this out.
Well, it turns out that in the Dell Modular Storage Manager, the iSCSI host port configuration window has a SAVE button that's off the bottom of my screen. So when I thought I'd enabled jumbo frames, I actually hadn't.
So, in these tests I made sure to save the configuration so that it actually applied. And, funnily enough, I saw some better performance. Who'd have thought, eh?
All these tests were with an unchanging log file size/auto-growth and data file size/auto-growth, as documented at the top of the previous post, so I won't repeat it here.
1) Enabling 4088-byte jumbo frames on the Intel server NIC to the data array
The Intel PRO/1000 PT Dual Port GigE NICs can handle 4088 or 9014 byte jumbo frames, and the iSCSI host ports on the data file MD3000i can only go up to 9000 bytes, so 4088 it is. The test ran in 18623 seconds, an 8.4% improvement over the baseline.
2) Enabling 9000-byte jumbo frames on the BroadCom server NIC to the log array
The BroadCom BCM5708C NetXtreme II GigE NICs can use a manually specified jumbo frame size so I set it to 9000 bytes, as well as the iSCSI host ports on the log file MD3000i. The test ran in 18284 seconds, a 1.8% improvement over the configuration in #1 above, and an overall 10% improvement over the baseline.
3) Using two Intel server NICs to the data array with least-queue-depth
Even with the jumbo frames enabled, I was still saturating the network link to the data array so I decided to use a pair of NICs cooperating on the same iSCSI channel, as several people had suggested. I configured two Intel NICs with 4088-byte jumbo frames, set them up as a paired set of connections to the same iSCSI controller (using two host ports on the same controller, so the NICs are essentially one-to-one), and let rip. The test ran in 18178 seconds, a 0.6% improvement over the configuration in #2 above, and an overall 10.5% improvement over the baseline.
4) Using two Intel server NICs to the data array with round-robin
I then changed the algorithm for the two Intel NICs to use round-robin instead of least-queue-depth. The test ran in 17719 seconds, a 2.5% improvement over the configuration in #3 above, and an overall 12.8% improvement over the baseline. You can see that in the perfmon capture lower down this post.
Clearly using paired-NICs with jumbo frames is the way to go. I also measured the throughput on the iSCSI arrays, and the 8-drive 15k RAID-10 SCSI array was pushing just under 125000 bytes per second – a 14% improvement over the best previous measurement.
My network utilization pretty-picture is as shown below:
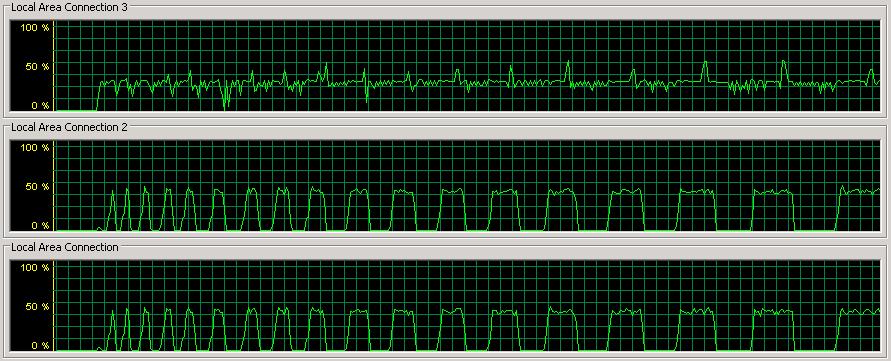
Connections 1 and 2 are the Intel NICs going to the data file array and connection 3 is the BroadCom NIC going to the log file array. This screen shot is capturing the start of a performance run as the log gradually increases in size. The network spikes on connections 1 and 2 are when data pages are being flushed out during checkpoints. You can see that the checkpoint get longer and further apart as the log file size increases. I explain this in depth in the post Interesting case of watching log file growth during a perf test. But as you can clearly see – no more network bottleneck!
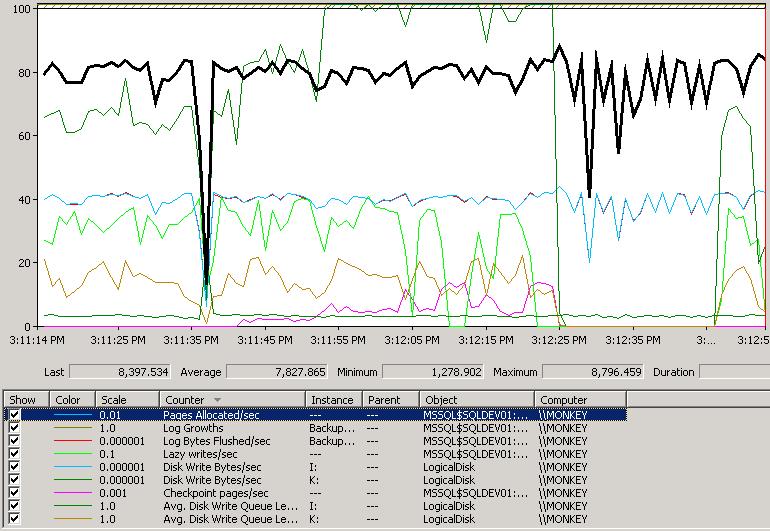
And here's a perfmon capture from the middle of one of the tests with paired-NICs:
Points to note:
- The Pages Allocated/sec (black highlighted line) is averaging a much higher number than before, with spikes up to almost 9000.
- The Disk Write Bytes/sec for the K: (the green line at the top) is off the scale, hitting near to the maximum capacity of the array as I described above.
- The Avg. Disk Write Queue Length for K: (the browny-red line) doesn't get much over 20, whereas previously it had been spiking in the mid 30s.
Now that I've removed the network bottleneck I'm going to experiment with the log file initial size and autogrowth rate, and then the data portion of the database.
One thing to bear in mind is that I'm tuning this for the optimal performance for the one task I'm trying to achieve right now. It'll be interesting to see whether this is the optimal configuration for large-scale reads, mixed workloads, index rebuilds, etc etc, and I'm also going to start throwing the Fusion-IO drives into the mix.
Hope you're enjoying learning along with me, stay tuned!
7 thoughts on “Benchmarking: 1-TB table population (part 5: network optimization again)”
Just curious if you’ve looked at fast track data warehouse setup that Microsoft offers?
Might give you some other things to try.
Greg E
Looks like 2 NICs for iSCSI made test a bit better. I can see that each iSCSI NIC uses 50% of the bandwidth, when the previous test with 1 NIC used 100% of the bandwidth. Not really good scalability. HDDs have enough capacity to fully (100%) utilize these 2 NICs, there’s something else going on on the IO path that prevents 2 NICs to work to their full capacity. Did you tweak MaxPendingRequest parameter for the MS iSCSI initiator? Good number for high workloads is 256. You need to change it in the registry.SQL Server I/O affinity may be a good candidate for these test too. Also, is it possible to include Avg.Sec/Write counter for T-Log disks for future tests? Another interesting find from these test is that lazy writer continue to work during checkpoints, good to know.
@Konstantin – Avg. Disk sec/Write for the log RAID array runs around 0.005. Haven’t touched anything with the MS iSCSI initiator – I’ll play with that as a separate set of tests.
@Greg Nope – not something I’m planning on trying any time soon.
Thanks!
@Konstantin – just checked in the registry – MaxPendingRequests is set to 255 already.
Out of curiosity can you run:
backup database <DBNAME> to disk=’NUL:’
to see what max throughput you can get from the I/O path?
BACKUP DATABASE successfully processed 134870081 pages in 6942.916 seconds (151.762 MB/sec).
That looks a little strange: about 100MB/sec during checkpoints and 150MB/sec during backup to null. Too big of a difference (about 50%) in my opinion. I can be wrong too. By briefly looking throught MD3000i white papers on the DELL web site:
http://www.dell.com/downloads/global/products/pvaul/en/pvault_md3000_whitepaper.pdf
http://www.dell.com/downloads/global/solutions/public/white_papers/IP-SAN-BestPractice-WP.pdf
http://www.dell.com/downloads/global/products/pvaul/en/powervault-md3000-md3000i-implementation.pdf
I see that there are several areas that may be checked and/or tuned on the MD3000i to improve iSCSI througput and latency:
– SAN write cache settings
– IP network tuning (2nd paper in the list) like STP, Flow Control, QoS etc
– Also CPU may be a bottleneck during checkpoint and limits write throughtput, SQL IO affibity may help here
I really appreciate your effort during these tests. I see a lot of companies that utilize SAN technology (iSCSI and FC) who do not see a reasonable IO performance and most of the time are in the dark of what is going on. These types of experiments with realistic database workloads are going to help a lot of SQL Server customers. Thanks again.