In the past week I’ve used Query Store to troubleshoot performance issues for two different customers running SQL Server 2016 and higher. I’ve presented a lot of sessions about what Query Store is, how to configure it, and basic use cases, but we really take it to the next level when we can provide Query Store examples from the real world. If you are running SQL Server 2016 or SQL Server 2017, I hope you’re using this feature!
Scenario 1
A long time customer reached out for some help after adding 50% more memory to their VM and seeing no improvement in performance. Sometimes you can’t throw hardware at an issue, and they wanted to look at using In-Memory OLTP to help improve performance. After a 10 minute discussion on In-Memory OLTP, where I explained why it wouldn’t magically solve their performance issues (and also explained the amount of testing that would need to be done prior to implementation), I took a look at the system.
I started with a health audit and a review of wait statistics. There were a couple settings they could change, but nothing was horribly misconfigured. Wait stats showed nothing remarkable. The majority of waits were due to CXPACKET, but the average duration was extremely low. They had some WRITELOG and PAGEIOLATCH waits, but these were also low in average duration. I asked if they had Query Store enabled…they did not. I requested that they enable it to capture query information while I starting to look at plan cache data. With Query Store collecting information, I used Glenn’s DMV queries to dig into the plan cache to look at queries that were executing most frequently, taking the longest, and consuming the most resources.
Now, while the plan cache has some fantastic information, it’s transitory. Plans can fall out of cache because they aren’t used, or because they get recompiled, so truly tracking information for execution frequency over time can be a bit tricky. Further, there are some plans that never make it into the plan cache (e.g. trivial plans or those with the RECOMPILE hint). This is where Query Store shines. EVERY query that executes can be captured in Query Store, even if it’s trivial or has the RECOMPILE hint. Further, execution frequency and resource use is aggregated over defined intervals (e.g. 15 minutes, 30 minutes), as determined by the INTERVAL_LENGTH_MINUTES setting. You can look back over a small or large period of time to see more than just what query performance looked like, but also how many times queries executed.
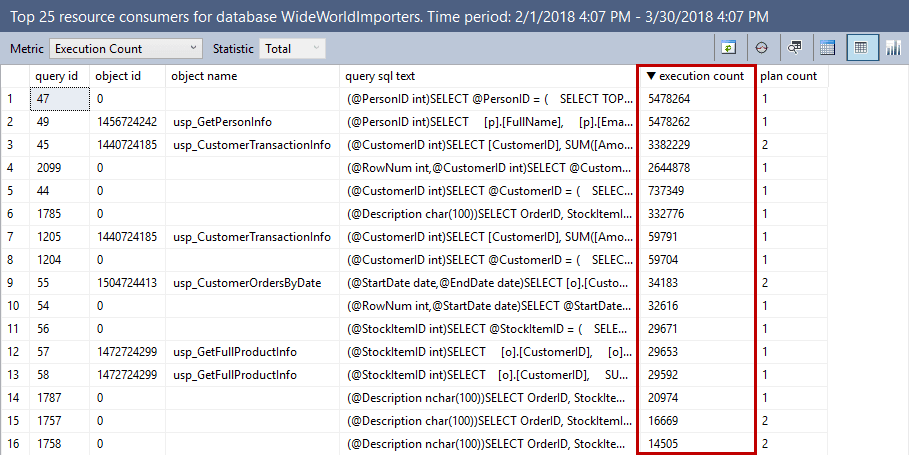
Several hours later, after a typical workload where users said performance was “slow”, we looked at the Query Store data. In terms of high resource queries, there were a few (e.g. lots of reads, or lots of CPU), but the execution frequency was low for a lot of those heavy hitters. Then we looked at queries executing most frequently – the death by a thousand cuts scenario – and here we could see that there were thousands of queries executing in an hour, and while individually a query might not take long to execute, or use a lot of resources, but cumulatively it added up.

In digging into some of those queries I quickly noticed that almost every plan had a missing index recommendation. I queried sys.indexes and found that almost 95% of the tables in the database had 2 indexes or less. It’s a rare case where a database is under-indexed. Their problem? Their workload volume and their data are slowly, but steadily increasing. They have some big tables that are missing indexes and causing scans, and even though all that data is sitting in memory (because they have enough server memory to hold the entire database), they are using a lot of CPU and time to roll through that data. I could have determined this with the information in the plan cache, but I would have had to set up a job to capture it on a regular basis and then write some queries to do analysis against it. With Query Store, I just had to enable it, let it capture the data, then use the UI to look at performance.
Scenario 2
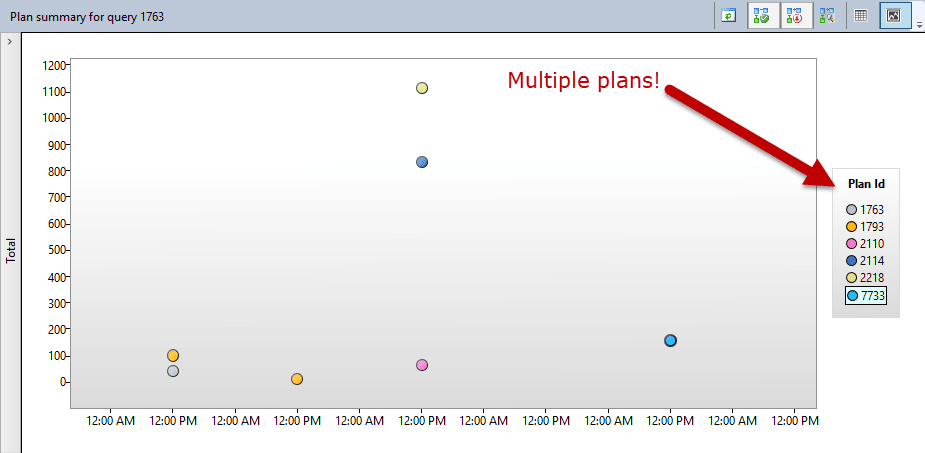
A new customer engaged with us after upgrading to SQL Server 2017. They had some extreme cases of variability in query performance – the system would be running fine and then all of the sudden performance would tank. They would knee-jerk and free the plan cache, then suddenly things would be great again. A couple hours later, the same problem. Rinse and repeat, rinse and repeat. We had them enable Query Store and within a couple hours we took a look at the data (letting them continue with the practice of freeing procedure cache when there was a problem). Within the Query Store UI I looked at CPU use for that window of time, and used the data grid to sort the output to view queries with multiple plans first. There it was…they had a select number of queries that had multiple plans with huge variations due to different input parameters – queries that were parameter sensitive.

We used Query Store to force the most optimal plan and thus stabilize performance, then we looked at the query itself and the different plans being generated. Within an hour we determined one code change and an index that would generate a consistent plan. After testing these changes and implementing them, we unforced the plan, confirmed that the new plan we wanted was consistently used, and moved on to the next challenge.
Summary
If you’re running SQL Server 2016 or higher, I highly recommend enabling Query Store…even if you have a third party monitoring tool. Don’t get me wrong, those tools are great and track a ton of information that Query Store doesn’t. But those tools don’t capture EVERY query, nor do they capture query metrics all the time. Lastly, they don’t provide the ability to force plans. You get all that with Query Store, and more 🙂
If you’re interested in learning more about Query Store from the ground up, you’re in luck! In two weeks I’m hosting a live, online Immersion Event for Query Store that you can attend from the comfort of your home (or your desk at work 🙂 You can find a course description and registration details here. I hope you’re able to attend!

5 thoughts on “Query Store Examples: Stories from customers”
Nice replay of the diagnosis of real world examples!
I absolutely love the Query Store, it’s amazing.
BTW, the “top resource consuming queries” is a great place to start for performance issues.
We have a really busy environment and have not yet seen how Query Store provides much value in analyzing our environment, at least with the busier systems. Additionally, the clean up is not working well for the one database even though we are on SQL Server 2016 Enterprise SP2. I set the maximum storage to 15 GB with the maximum plans per query at 20 and stale query threshold at 5 days. The sized_based_cleanup_mode_desc shows Auto but regularly goes to read-only because that doesn’t appear to work. It’s not that it grows quickly either. It took over a day to grow the last 1 GB this week before it finally went to read-only.
Hi Chuck-
Based on the information you provided, it sounds like you have an extremely ad-hoc workload (I talk about this in another post: https://www.sqlskills.com/blogs/erin/query-store-performance-overhead/) if you’ve consumed 15GB of space with only 5 days of retention. If you believe that the status is changing to read-only at incorrect times, then I would recommend monitoring with Extended Events and possibly opening a case with Microsoft. The status of Query Store will switch to read-only if the space used exceeds the max you’ve set for Query Store (15GB) and then once cleanup finishes and the space is below that 15GB, it will switch to read-write again.
Hope that helps,
Erin