This post, Finding the Slowest Query in a Stored Procedure, originally appeared on the PASS website. It has been re-posted here with permission.
Figuring out exactly what causes slow performance for a stored procedure can sometimes feel like trying to unravel a ball of Clark Griswold’s Christmas lights. It’s not uncommon to see procedures with hundreds, even thousands of lines of code. You may have been told which stored procedure runs slow by a user or manager, or you might have found it by looking in SQL Server DMVs. Either way, once you have detected the offending procedure, where do you start?
If you’re running SQL Server 2016, one option is Query Store. Query Store captures individual queries, but it also captures the object_id, so you can find all the queries that are associated with an object to determine which ones are problematic.
Setup
We’ll work with a restored copy of the WideWorldImporters database, which you can download from GitHub.
First, since this is a demo database, we will enable Query Store and clear out any historical information:
ALTER DATABASE [WideWorldImporters]
     SET QUERY_STORE = ON;
GO

ALTER DATABASE [WideWorldImporters]
     SET QUERY_STORE (
     OPERATION_MODE=READ_WRITE,
     INTERVAL_LENGTH_MINUTES = 10
     );
GO

/*
Do not run in a Production database unless you want
to remove all Query Store data
*/

ALTER DATABASE [WideWorldImporters]
    SET QUERY_STORE CLEAR;
GO
Next, we will create a very simple stored procedure that has multiple queries within.
USE [WideWorldImporters];
GO

DROP PROCEDURE IF EXISTS [Sales].[usp_GetCustomerDetail];
GO

CREATE PROCEDURE [Sales].[usp_GetCustomerDetail]
     @CustomerName NVARCHAR(100)
AS

CREATE TABLE #CustomerList (
     [RowID] INT IDENTITY (1,1),
     [CustomerID] INT,
     [CustomerName] NVARCHAR (100)
     );

INSERT INTO #CustomerList (
     [CustomerID],
     [CustomerName]
     )
SELECT
     [CustomerID],
     [CustomerName]
FROM [Sales].[Customers]
WHERE [CustomerName] LIKE @CustomerName
UNION
SELECT
     [CustomerID],
     [CustomerName]
FROM [Sales].[Customers_Archive]
WHERE [CustomerName] LIKE @CustomerName;

SELECT
     [o].[CustomerID],
     [o].[OrderID],
     [il].[InvoiceLineID],
     [o].[OrderDate],
     [i].[InvoiceDate],
     [ol].[StockItemID],
     [ol].[Quantity],
     [ol].[UnitPrice],
     [il].[LineProfit]
INTO #CustomerOrders
FROM [Sales].[Orders] [o]
INNER JOIN [Sales].[OrderLines] [ol]
     ON [o].[OrderID] = [ol].[OrderID]
INNER JOIN [Sales].[Invoices] [i]
     ON [o].[OrderID] = [i].[OrderID]
INNER JOIN [Sales].[InvoiceLines] [il]
     ON [i].[InvoiceID] =  [il].[InvoiceID]
     AND [il].[StockItemID] = [ol].[StockItemID]
     AND [il].[Quantity] = [ol].[Quantity]
     AND [il].[UnitPrice] = [ol].[UnitPrice]
WHERE [o].[CustomerID] IN (SELECT [CustomerID] FROM #CustomerList);

SELECT
     [cl].[CustomerName],
     [si].[StockItemName],
     SUM([co].[Quantity]) AS [QtyPurchased],
     SUM([co].[Quantity]*[co].[UnitPrice]) AS [TotalCost],
     [co].[LineProfit],
     [co].[OrderDate],
     DATEDIFF(DAY,[co].[OrderDate],[co].[InvoiceDate]) AS [DaystoInvoice]
FROM #CustomerOrders [co]
INNER JOIN #CustomerList [cl]
     ON [co].[CustomerID] = [cl].[CustomerID]
INNER JOIN [Warehouse].[StockItems] [si]
     ON [co].[StockItemID] = [si].[StockItemID]
GROUPBY [cl].[CustomerName], [si].[StockItemName],[co].[InvoiceLineID],
     [co].[LineProfit], [co].[OrderDate], DATEDIFF(DAY,[co].[OrderDate],[co].[InvoiceDate])
ORDER BY [co].[OrderDate];
GO
Viewing the Data
With the stored procedure created, we can now execute it with different input parameters:
EXEC [Sales].[usp_GetCustomerDetail] N'Alvin Bollinger';
GO 10
EXEC [Sales].[usp_GetCustomerDetail] N'Tami Braggs';
GO 10
EXEC [Sales].[usp_GetCustomerDetail] N'Logan Dixon';
GO 10
EXEC [Sales].[usp_GetCustomerDetail] N'Tara Kotadia';
GO 10
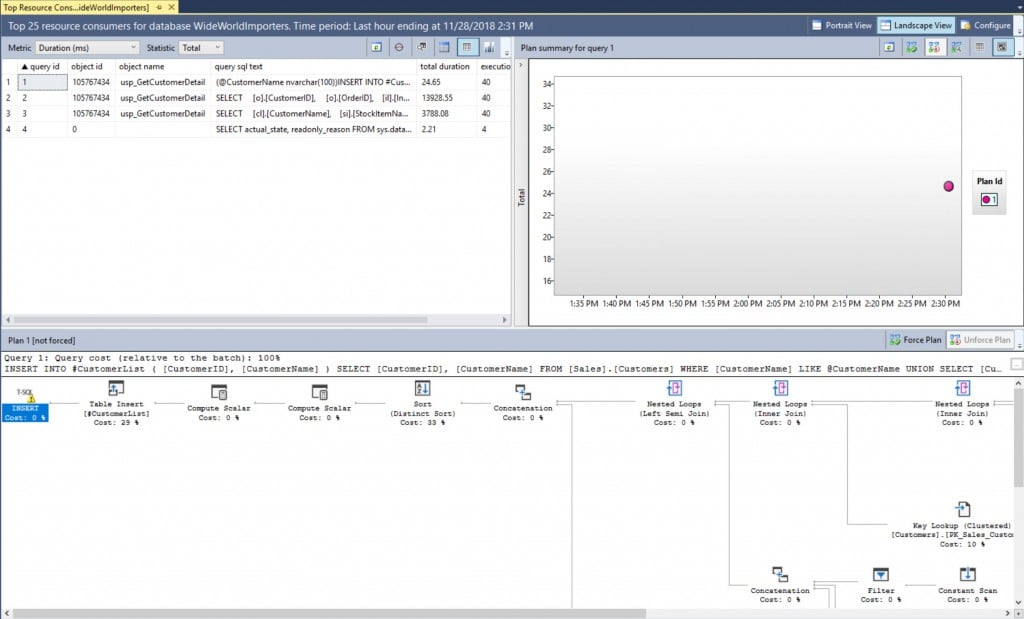
If we use the Query Store Top Resource Consuming Queries report within Management Studio, we can see what individual queries have been executed:

In this example, the queries for our stored procedure are quite evident – but we don’t have much of a workload. In a production system, all the queries from a stored procedure probably won’t appear in this view. It will likely be necessary to use T-SQL to find all the queries for a stored procedure, which currently has no built-in report to find all queries for a given stored procedure. Using the query below, we can list all queries captured by Query Store for the usp_GetCustomerDetail procedure:
SELECT
     [qsq].[query_id],
     [qsp].[plan_id],
     [qsq].[object_id],
     [qst].[query_sql_text],
     ConvertedPlan = TRY_CONVERT(XML, [qsp].[query_plan])
FROM [sys].[query_store_query] [qsq]
JOIN [sys].[query_store_query_text] [qst]
     ON [qsq].[query_text_id] = [qst].[query_text_id]
JOIN [sys].[query_store_plan] [qsp]
     ON [qsq].[query_id] = [qsp].[query_id]
WHERE [qsq].[object_id] = OBJECT_ID(N'Sales.usp_GetCustomerDetail');
GO

This confirms which queries are part of the procedure – but if we are troubleshooting performance, we are really interested in execution statistics. We can expand this query slightly to get the data we want:
SELECT
     [qsq].[query_id],
     [qsp].[plan_id],
     [qsq].[object_id],
     [rs].[runtime_stats_interval_id],
     [rsi].[start_time],
     [rsi].[end_time],
     [rs].[count_executions],
     [rs].[avg_duration],
     [rs].[avg_cpu_time],
     [rs].[avg_logical_io_reads],
     [rs].[avg_rowcount],
     [qst].[query_sql_text],
     ConvertedPlan = TRY_CONVERT(XML, [qsp].[query_plan])
FROM [sys].[query_store_query] [qsq]
JOIN [sys].[query_store_query_text] [qst]
     ON [qsq].[query_text_id] = [qst].[query_text_id]
JOIN [sys].[query_store_plan] [qsp]
     ON [qsq].[query_id] = [qsp].[query_id]
JOIN [sys].[query_store_runtime_stats] [rs]
     ON [qsp].[plan_id] = [rs].[plan_id]
JOIN [sys].[query_store_runtime_stats_interval] [rsi]
     ON [rs].[runtime_stats_interval_id] = [rsi].[runtime_stats_interval_id]
WHERE [qsq].[object_id] = OBJECT_ID(N'Sales.usp_GetCustomerDetail')
     AND [rs].[last_execution_time] > DATEADD(HOUR, -1, GETUTCDATE())
     AND [rs].[execution_type] = 0
ORDER BY [qsq].[query_id], [qsp].[plan_id], [rs].[runtime_stats_interval_id];
GO

We’ve only retrieved CPU, duration, and IO metrics in this query – much more information is available in Query Store depending on what you’re interested in seeing, or the problem you are trying to solve. A quick review of the duration and CPU columns helps us identify the second query in the stored procedure as the one that takes the longest to execute.
There are a few important items worth noting about the query we ran, and its output:
1. We restricted the runtime statistics to only those from the last hour with this predicate:
[rs].[last_execution_time] > DATEADD(HOUR, -1, GETUTCDATE())
2. We restricted the output to show only successful executions with this predicate:
[rs].[execution_type] = 0
3. Runtime statistics are aggregated across the collection interval, which is set with the INTERVAL_LENGTH_MINUTES option. For this demo, the interval was set to 10 minutes, a value that’s low for a production environment, and we’re only seeing data for one 10-minute interval (19:30 to 19:40 on 2018-11-28) because we’ve only run our set of queries one time.
*If you’re not familiar with Query Store settings and considerations around them, check out my Query Store Settings post.
4. The statistics represent the average CPU, duration, logical I/O, etc. for a query’s plan, based on how many times the query was executed in that interval (count_executions). Minimum, maximum, and standard deviation numbers for each counter are also calculated and can be useful in finding plans with high variability.
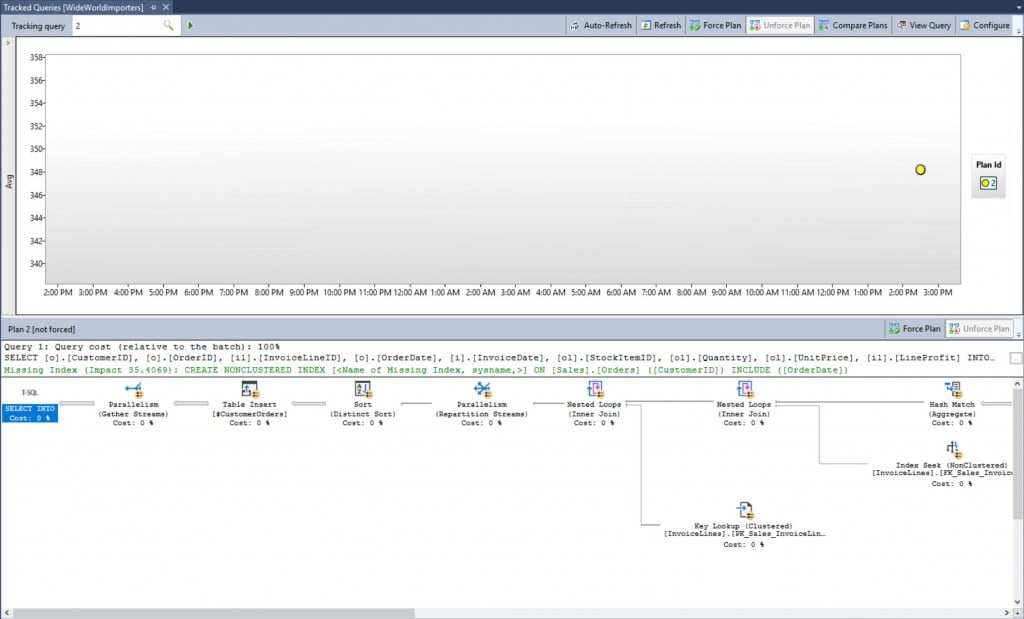
From here, we can drill further into this specific query using the Query Store Tracked Queries report and the query_id (2).

Again, we’ve only executed the stored procedure 40 times in total, so while it’s great to see this query’s plan and see that we have a missing index recommendation, this data isn’t that interesting compared to what we might see in a production environment. We can use a simple loop to run the stored procedure repeatedly with different Customer Names, and let that run for a bit to generate some data:
DECLARE @CustomerID INT = 801
DECLARE @CustomerName NVARCHAR(100)

WHILE 1=1
BEGIN

     SELECT @CustomerName = SUBSTRING([CustomerName], 1, 10) + '%'
     FROM [Sales].[Customers]
     WHERE [CustomerID] = @CustomerID;

     EXEC [Sales].[usp_GetCustomerDetail] @CustomerName;

     IF @CustomerID < 1092
     BEGIN
          SET @CustomerID = @CustomerID + 1
     END
     ELSE
     BEGIN
          SET @CustomerID = 801
     END

END
Now if we look at our execution statistics, you will see we have more intervals of data (noted by the start_time and end_time, and the respective runtime_stats_interval_id). In addition, you’ll note that query_id 3 has three plans (plan_ids 3, 16, and 18):

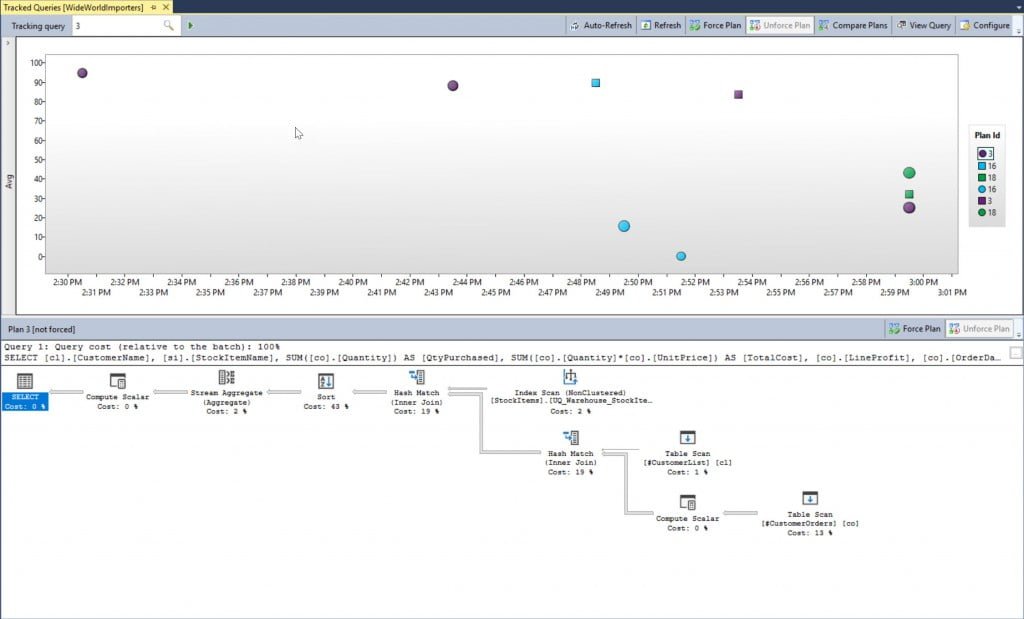
Looking at query performance across time is not that easy in the grid output. If we look at any individual query again in the Tracked Queries report for a 30-minute window, we get a much better view of the data:

Important points about this output:
1. This is query_id 3, which has three different plans, which are represented by the different plan_id values on the right, and different colors on the graph.
2. The circles represent the average values for successful execution. The squares represent canceled executions (which we excluded in our query). If you see a triangle, that means an error in the execution.
3. Clicking on the different plan_id values displays the corresponding query plan in the bottom window. Hold down the SHIFT key to select two plan_id values, then use the ComparePlans button above to open a new window and see both plans side-by-side.
Even though this view allows us to trend individual query performance over time, we don’t get a good sense of overall query performance relative to other queries in the stored procedure. We have to go back to T-SQL for that, and for this example, we’ll aggregate our metrics based on the query_id and the plan_id, as a query can have multiple plans and they may have wildly different performance characteristics.
SELECT
     [qsq].[query_id],
     [qsp].[plan_id],
     OBJECT_NAME([qsq].[object_id])AS [ObjectName],
     SUM([rs].[count_executions]) AS [TotalExecutions],
     SUM([rs].[avg_duration]) / SUM([rs].[count_executions]) AS [Avg_Duration],
     SUM([rs].[avg_cpu_time]) / SUM([rs].[count_executions]) AS [Avg_CPU],
     SUM([rs].[avg_logical_io_reads]) / SUM([rs].[count_executions]) AS [Avg_LogicalReads],
     MIN([qst].[query_sql_text]) AS[Query]
FROM [sys].[query_store_query] [qsq]
JOIN [sys].[query_store_query_text] [qst]
     ON [qsq].[query_text_id] = [qst].[query_text_id]
JOIN [sys].[query_store_plan] [qsp]
     ON [qsq].[query_id] = [qsp].[query_id]
JOIN [sys].[query_store_runtime_stats] [rs]
     ON [qsp].[plan_id] = [rs].[plan_id]
JOIN [sys].[query_store_runtime_stats_interval] [rsi]
     ON [rs].[runtime_stats_interval_id] = [rsi].[runtime_stats_interval_id]
WHERE [qsq].[object_id] = OBJECT_ID(N'Sales.usp_GetCustomerDetail')
     AND [rs].[last_execution_time] > DATEADD(HOUR, -1, GETUTCDATE())
     AND [rs].[execution_type] = 0
GROUP BY [qsq].[query_id], [qsp].[plan_id], OBJECT_NAME([qsq].[object_id])
ORDER BY AVG([rs].[avg_cpu_time]) DESC;
GO
The data is ordered by avg_cpu_time descending, so the worst performing query in terms of CPU is listed first. You can change the order based on what is of interest to you, but you’ll notice that query_id 2 is still our worst offender.

Conclusion
There are multiple sources of query performance data within SQL Server, and the DMVs and Extended Events (or Trace for those of you running SQL Server 2008R2 and below) are traditional tools used to understand how long it takes for a query to execute. Query Store is a new option for capturing query metrics, and it shines over both in that it’s persisted in the user database (the DMVs only represent what’s currently in cache, and are cleared on a restart). In addition, Query Store doesn’t require any setup other than enabling it one time – you need to have an event session defined and running to capture query performance with Extended Events, and the same with Trace. Lastly, Query Store allows you to look at all the queries for a stored procedure and drill into what is not performing well either at this moment, or over time.
T-SQL code used here can be found in its entirety on GitHub.

5 thoughts on “Finding the Slowest Query in a Stored Procedure”
Hey Erin,
There is a typo in the last query code –> “AND [rs].[last_execution_time] > DATEADD(HOUR, -1, GETUTCDATE())”. Think it killed the “>” 🙂
Thanks for sharing your knowledge
Timon,
Fixed, thank you for letting me know!
Erin
Hi Erin
I’m finding your info on Query Store really great, however, an average of an average does not produce an average!
AVG([rs].[avg_duration]) AS [Avg_Duration] should be replaced by
SUM([rs].[count_executions] * [rs].[avg_duration]) / Sum([rs].[count_executions]) AS [Avg_Duration]
🙂
Thanks for the catch Adrian! I feel like I fixed that in later variations of the script, but never went back to this blog post to edit it. Appreciate it!