Many posts and articles that discuss parallelism and SQL Server revolve around query performance and query optimization. Parallelism can affect performance, and some DBAs and database developers spend a great amount of time trying to find the “right” max degree of parallelism (MAXDOP) setting for an instance. Finding that right value is a science and an art, but understanding what degree of parallelism is used by SQL Server for standard maintenance tasks is straight science.
Parallelism and Instance Configuration
To start, I’m working under the assumption that you are familiar with parallelism and understand the implications of leaving max degree of parallelism set to 0, changing it to 1, or setting it to another value. Note: If you’re looking for background reading, I recommend Adam Machanic’s SQL University Parallelism Week posts (Part 1, Part 2, and Part 3), and Paul White’s article, Understanding and Using Parallelism in SQL Server. To understand what impact max degree of parallelism has on maintenance tasks, we need to know its value for an instance, and the easiest way to find it is via sys.configurations:
SELECT [name], [value], [value_in_use]
FROM [sys].[configurations]
WHERE [name] = 'max degree of parallelism';
In my environment, it’s set to 4 for purposes of this demo (I have 8 logical processors on my laptop):

The three maintenance tasks I want to cover in this series are database consistency checks, index rebuilds, and statistic updates. As you might have guessed from the title, this first post will cover consistency checks.
Database Consistency Checks
In November of last year I blogged about DBCC CHECKDB and parallel checks due to an inconsistency I found in Books Online. The inconsistency has since been fixed in BOL (hooray for Connect items!), and the short story is that any consistency check (CHECKDB, CHECKTABLE, CHECKFILEGROUP, and CHECKCATALOG) is single-threaded in Standard Edition. Regardless of the number of cores in your server and the MAXDOP setting for the instance, any CHECK command will be single-threaded.
In Enterprise Edition, checks can be done in parallel, and the max degree of parallelism is determined by the Query Processor. The Query Processor respects the max degree of parallelism setting for the instance, therefore since I have MAXDOP = 4 for my instance, up to four processors can be used by a CHECK command. There is no MAXDOP option that can be included with a CHECK command; it always respects the value set for the instance. We can prove this using Extended Events and the sp_statement_completed and query_post_execution_showplan events.
*EDIT: For versions SQL Server 2014 SP2 and higher there is a MAXDOP option you can specify for CHECKDB. Please see the updated DBCC CHECKDB documentation for complete details.
**Important note here: it is NOT recommended to capture the query_post_execution_showplan event against a live, production system. This event generates significant performance overhead, and you are warned of this when configuring the session via the GUI. If you repeat any of the demos here, please make sure to execute them against a test environment. I really do not want you to bring down your production environment.**
Here are the statements to create the event session, start it, run CHECKDB, then stop the event session. I am using a file target to capture the output, and the path is C:\temp. You may need to modify this path for your environment.
CREATE EVENT SESSION [CapturePlans] ON SERVER
ADD EVENT sqlserver.query_post_execution_showplan(
ACTION(sqlserver.plan_handle,sqlserver.sql_text)),
ADD EVENT sqlserver.sp_statement_completed(
ACTION(sqlserver.sql_text))
ADD TARGET package0.event_file(SET filename=N'C:\temp\CapturePlans.xel'),
ADD TARGET package0.ring_buffer(SET max_memory=(102400))
WITH (MAX_MEMORY=4096 KB,EVENT_RETENTION_MODE=ALLOW_SINGLE_EVENT_LOSS,MAX_DISPATCH_LATENCY=30 SECONDS,
MAX_EVENT_SIZE=0 KB,MEMORY_PARTITION_MODE=NONE,TRACK_CAUSALITY=OFF,STARTUP_STATE=OFF);
GO

ALTER EVENT SESSION [CapturePlans]
ON SERVER
STATE=START;
GO

DBCC CHECKDB (AdventureWorks2012) WITH NO_INFOMSGS;
GO

ALTER EVENT SESSION [CapturePlans]
ON SERVER
STATE=STOP;
GO
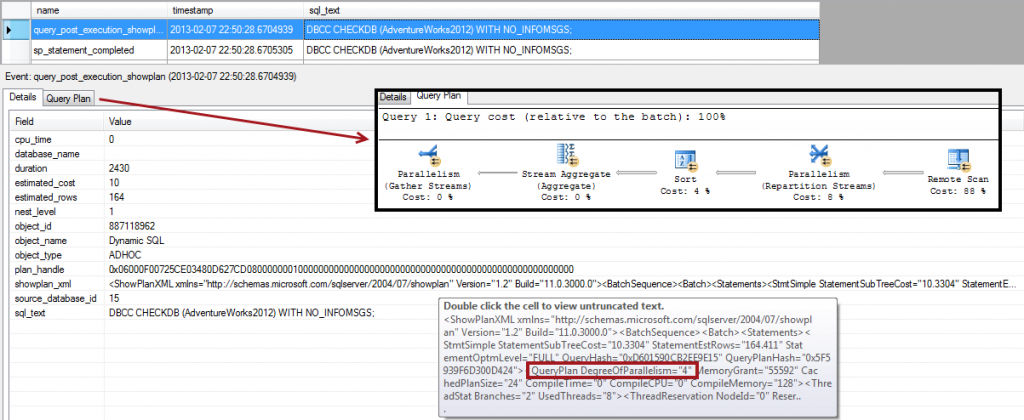
After stopping the event session, open the .xel file from C:\temp in Management Studio and add the sql_text column to the display to easily find the CHECKDB statement. In the screen shot below the query_post_execution_showplan event is highlighted, you can see the sql_text, and I hovered over the showplan_xml to show the first part of the xml version of the plan. Note the red box around QueryPlan DegreeofParallelism…it’s 4, as expected because it’s set to that for the instance. The query plan is also included in the screen shot to show the full plan.

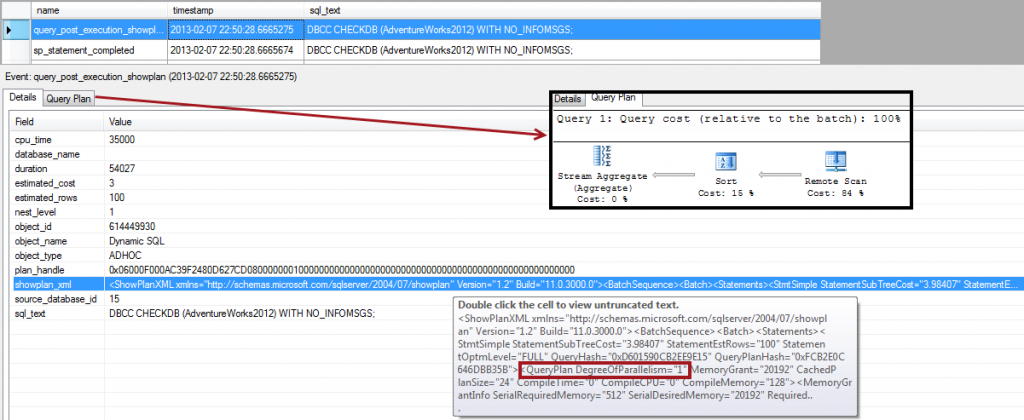
To view the full XML for the plan, just double-click the showplan_xml value and it will open in a new window. Just for fun, if we change MAXDOP for the instance to 1 (which I’ve seen in some OLTP environments) note that CHECKDB now runs single-threaded, regardless of SQL Server version.
sp_configure 'show advanced options', 1;
GO
RECONFIGURE WITH OVERRIDE;
GO
sp_configure 'max degree of parallelism', 1;
GO
RECONFIGURE WITH OVERRIDE;
GO

ALTER EVENT SESSION [CapturePlans]
ON SERVER
STATE=START;
GO

DBCC CHECKDB (AdventureWorks2012) WITH NO_INFOMSGS;
GO

ALTER EVENT SESSION [CapturePlans]
ON SERVER
STATE=STOP;
GO
Again, if we open the most recent .xel file in C:\temp and add the sql_text column, we can see that CHECKDB runs single-threaded:

Realize that if max degree of parallelism is set to 1 for instance, and you’re running Enterprise Edition, your consistency checks could be taking longer than necessary. The only way to work around this in Enterprise Edition is to change the max degree of parallelism for the instance, run the check, then change it back. Alternatively, in some enterprise environments that are 24/7, it may not be desirable to have CHECK commands use a high number of threads. In that case, lowering max degree of parallelism while CHECKs run may not be an option – you may not want to impact the performance of your regular queries. Instead, you could disable parallel checking for CHECK commands entirely using trace flag 2528, or you could use Resource Governor to limit CPU use. And one final, interesting note (thanks Paul): CHECKALLOC is always single-threaded, regardless of Edition.
In the next post we’ll look at parallelism and index maintenance.
