Now before I begin this post, a quick disclaimer…
SQLskills partners with SQL Sentry on a couple of things. We periodically write guest-posts on SQLPerformance.com and SQL Sentry also provides exclusive sponsorship of two of our Immersion Events. I am also a big fan of SQL Sentry Plan Explorer, but that would have been the case regardless of the existing business relationships.
With that said, I wanted to write a post about SQL Sentry’s new “AlwaysOn Monitoring” functionality integrated into SQL Sentry Performance Advisor for SQL Server v7.5, highlighting a few areas that I think are useful after an initial, informal investigation.
I explored this new functionality in a VMware environment with ten availability groups configured on a four node Windows Server Failover Cluster (WSFC) with four standalone SQL Server instances.
Here were the top areas that stood out for me…
Get your bearings quickly
Let’s say you’re the new DBA on the team. Your SQL Server production environment is being monitored by SQL Sentry Performance Advisor and you want to get a quick look at the current availability group topologies…
Steps I performed to do this:
- Launched the SQL Sentry Client
- Right-clicked the Default Site and selected “Open AlwaysOn Management”
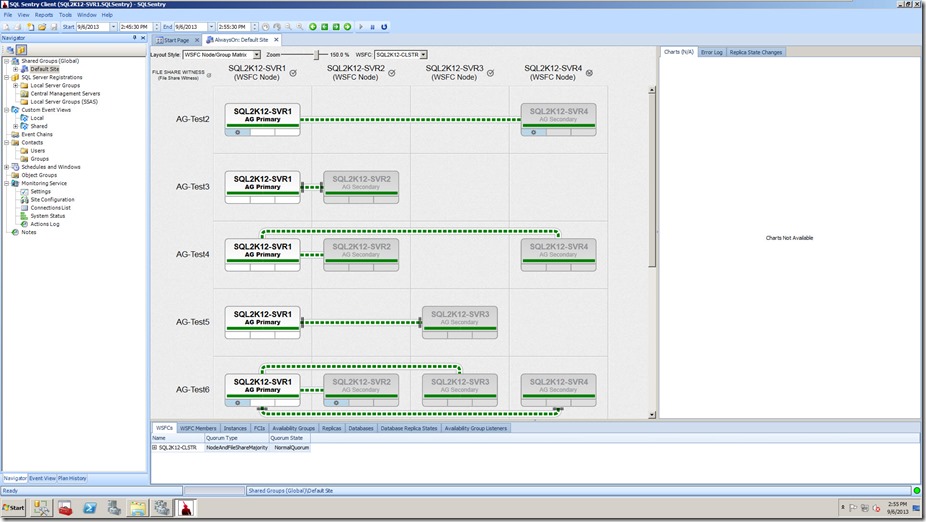
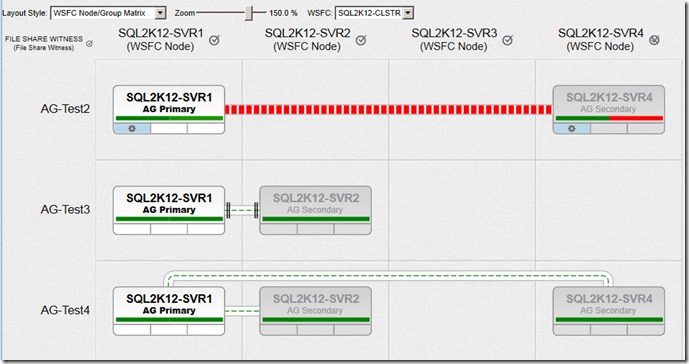
This is what I saw by-default:
The zoom-level for the availability group topology visualizations was set to 150% and the layout style was set to “WSFC Node/Group Matrix”. Scrolling down I was able to see all ten availability groups defined on SQL Server instances hosted on the WSFC.
There are various layout styles to choose from, including:
- “WSFC Node / Group Matrix” (what you saw in the earlier visual)
- “WSFCs” (showing the monitored WSFCs in your environment)
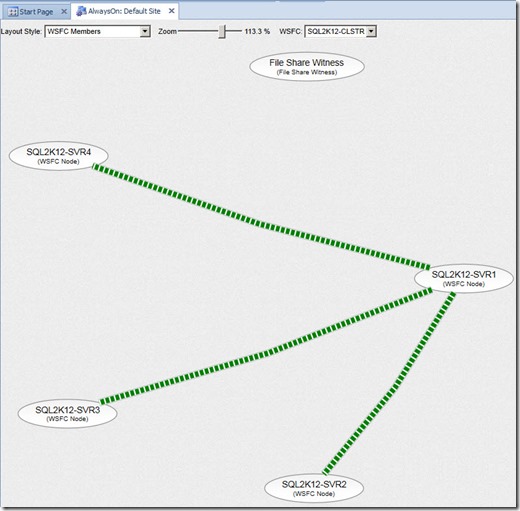
- “WSFC Members” (nodes associated with a specific WSFC)
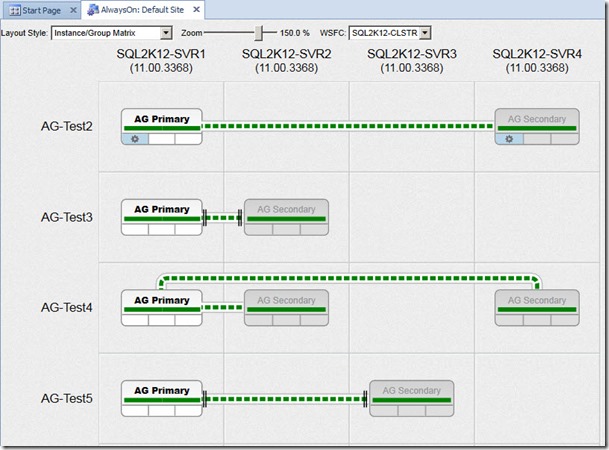
- “Instance/Group Matrix”
- “Instances”
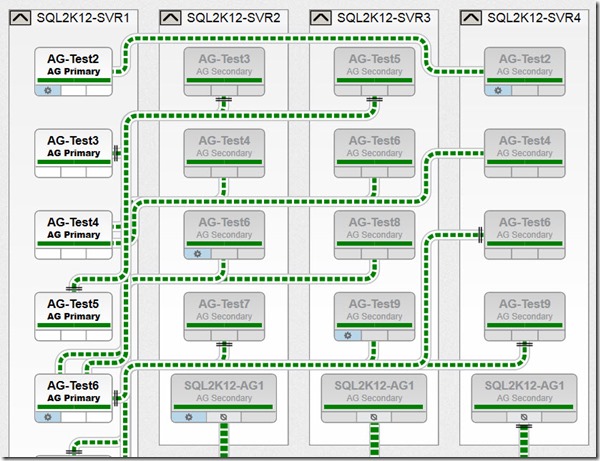
- “Groups/Replicas”
Availability Group Configuration Visualizations
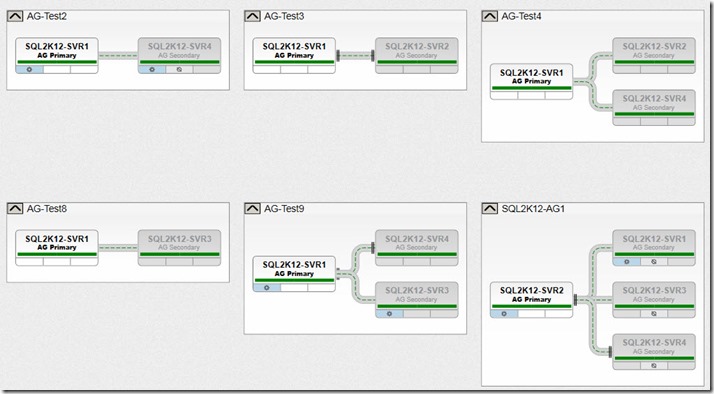
You can answer quite a few questions by just looking at the availability group animations. You’re seeing static screen shots on this blog post – but keep in mind that this view changes state dynamically. The image below shows me that “AG-Test2” has two replicas on two nodes out of the four node WSFC:
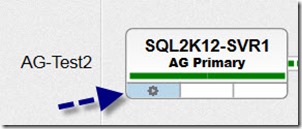
I can clearly see which replica is primary and which is secondary, and the spoke symbol (zoomed in below) lets me know which replicas are configured for automatic failover:
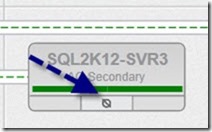
If a replica is set for read-only connection mode, we’ll see the following symbol:
Hovering over the read-only symbol will clarify if it is read-intent only (SQL Sentry uses the word “Specified” for read-intent and just “All” when read-intent is not used).
If replicas are asynchronous, we’ll see a double-pipe symbol by the associated replica (I put red boxes around them so you could see exactly what I’m talking about):
The connecting pipelines also have inherent meaning. Let’s say you’ve heard about performance issues in the availability group topology and you want to narrow down quickly to the offending availability group, the bars within the pipeline will automatically be sized based on relative load of the other availability groups and you’ll see the colors shift from green, to yellow to red for availability groups pushing more load:
Hovering over the pipelines will also provide information regarding KB to Replica/Sec and the Recovery queue KB.
Tabular Data
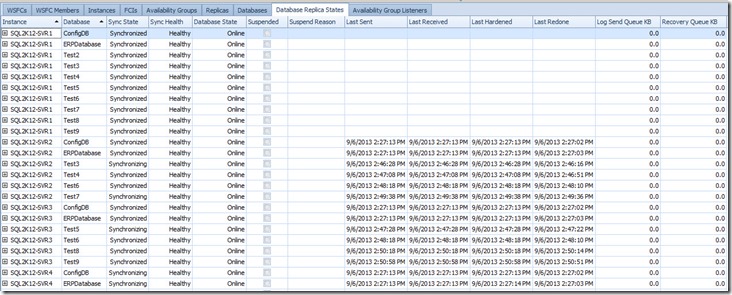
If animated topology layouts aren’t your thing, you have a series of tabs below the layout pane that are responsive to the objects you click in the layout area. Tabs cover WSFCs, WSFC Members, Instances, FCIs, Availability Groups, Replicas, Databases, Database Replica States and Availability Group Listener information. Below shows an example of database replica states information:
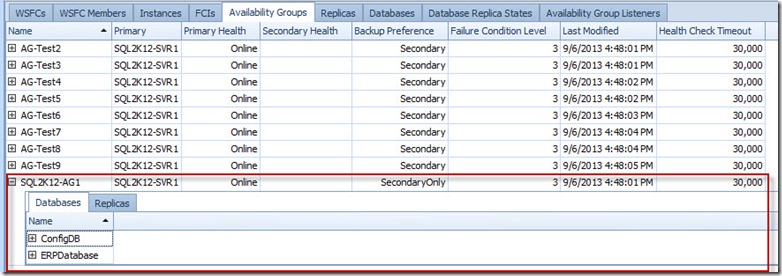
There is a significant amount of information exposed in the grid section and based on initial impressions, I think it would be likely that I would most often view the Availability Groups tab and Database Replica States tabs.
Most of the grids are expandable. For example- expanding an availability group to see the availability databases and then clicking Replicas to see where they are hosted:
Charts
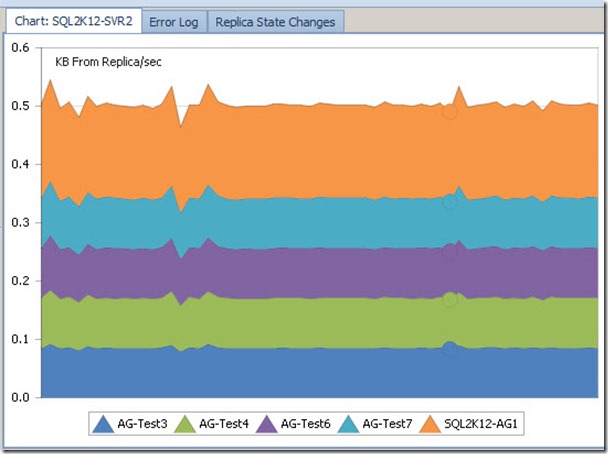
In the upper-right hand pane you’ll see dynamic chart graphics depending on where you’ve clicked. For example, selecting a specific WSFC Member on the WSFC Members tab shows the following KB From Replica/Sec data:
Error Logs and Replica State Changes
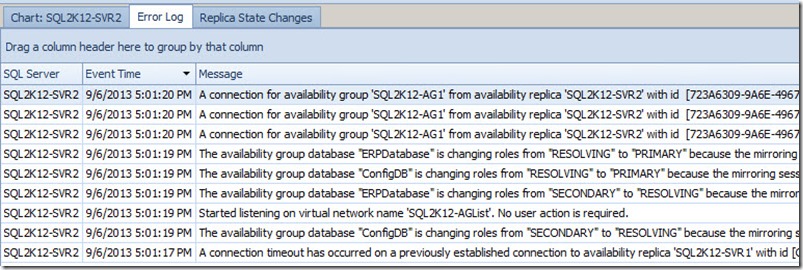
In the same area as the Chart tab is an Error Log and Replica State Changes tab. This information isn’t on by default, and you if you want this information you need to enable it explicitly (the interface makes this clear). The reason behind this is related to the monitoring noise that then gets added to the SQL Server Error Log, with an ongoing entry of “Using ‘dbghelp.dll’ version ‘4.0.5’”. For more information on this issue, see the Connect item “xEvents: selecting System Health information records Using ‘dbghelp.dll’ version ‘4.0.5’ in Errorlog”.
But if you’re okay with the additional noise in the SQL Server Error Log, these two information panes can be useful in order to see real-time availability group activity. For example – here is what we see after a controlled failover of an availability group for the Error Log:
And here is what we see for Replica State Changes:
And as an aside, the visualization of the availability group does dynamically change during a failover event – and you’ll see a change in pipeline activity and also in the status color (the example below shows a red/pink represent of an “unhealthy” availability group state).
Wish List
I do have a few items on the wish list:
- A new name. “AlwaysOn” is a Microsoft marketing term that encompasses more than Availability Groups, so I think the name should be “Availability Group Monitoring.”
- Dynamic auto-zoom based on the number of objects in a topology.
- I think some of the graphical elements could use some clarity – for example, adding a legend that translates the symbols for new users of this functionality.
- Have an easy way to export out the tabular data from the various panes.
My first impressions are very favorable and I do think this is a useful tool – particularly for environments that have numerous availability groups and higher complexity topologies.
PS: This product also provides built-in alerting for health changes and failovers that isn’t provided natively by Microsoft, but I didn’t get a chance to investigate this yet. I do plan on testing this out in the future and will share any interesting findings accordingly.

