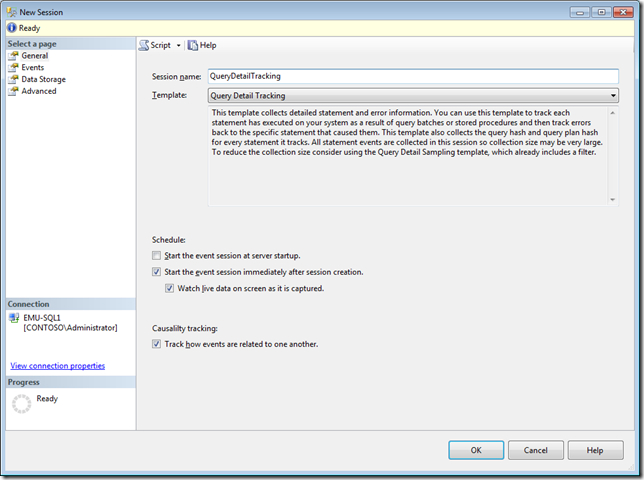
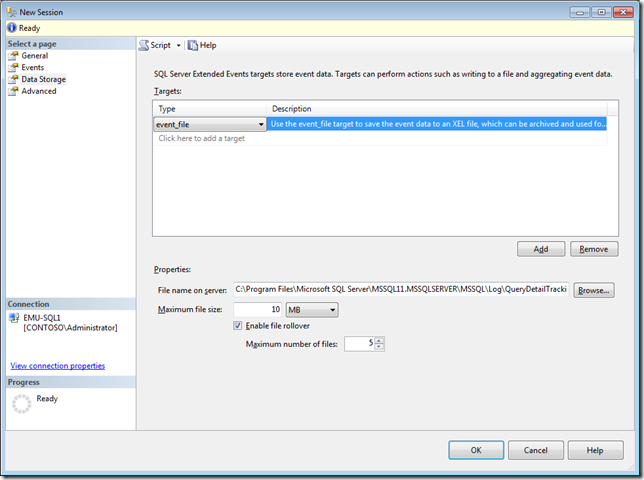
In SQL Server 2012 there are number of new ways to view target data generated by Extended Events Sessions, including a live streaming view as the events actually generate from the server, similar to the way SQL Server Profiler functions. For this blog post, I am going to use the Query Detail Tracking template that ships by default with SQL Server 2012, and instead of using the default ring_buffer target, make use of the event_file target to show how to use the UI functionality to read and process through files that are generated by Extended Events.
Check It Out!
SQLskills Complete Short Course Bundle
$4,575.00 Original price was: $4,575.00.$899.00Current price is: $899.00.
The Event Session has been setup with a 10MB maximum file size and 5 rollover files. The Event Session is also configured to start automatically when the Wizard closes, and the option to Watch live data on screen as it is captured is also selected. When you close the dialog, the Live Data viewer will open and connect to the SQL Server instance to begin reading the event stream from the server.
Live Data viewer options
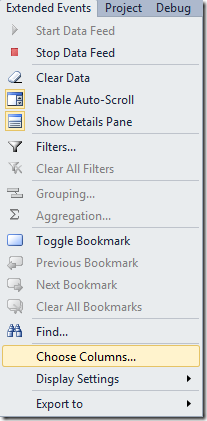
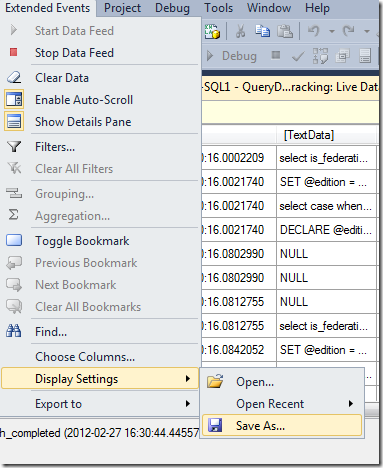
There are number of commands that exist for the Live Data viewer that are accessible through the Extended Events menu or through the toolbar that displays when the Live Data viewer is the active window inside of SQL Server Management Studio. The buttons on the toolbar are in the exact same order as the menu items in the Extended Events menu.
If you don't have enough screen real estate for the toolbar to display completely, some of the buttons may not display but they will still be available through the drop down at the end of the toolbar as shown below.
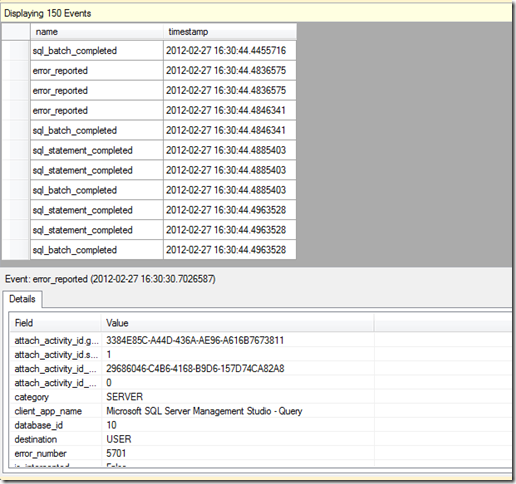
The default view for any new Event Session in the Live Data viewer only shows two columns in the gridview, the event name and the timestamp for when the event was generated in the server. The reason for this limited view initially is that there are to many columns available in Extended Events, and it is impossible to provide a globally useful initial display in the environment. Instead for each event, all of the columns are provided in the Details pane below the main gridview.
Choosing Columns
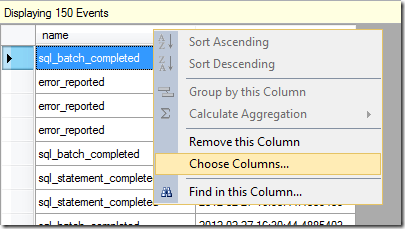
Columns can be added to the table view a number of ways. The Choose Columns menu item in the Extended Events menu or on the toolbar can be used, or you can also click on the column names on the gridview and select the Choose Columns menu item from the context menu.
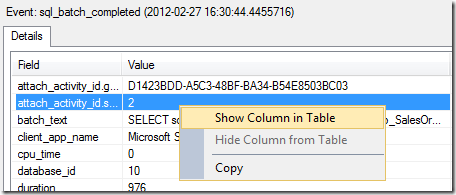
Additionally you can add a single column from the Details pane by right clicking on the column and selecting the Show Column in Table menu item from the context menu.
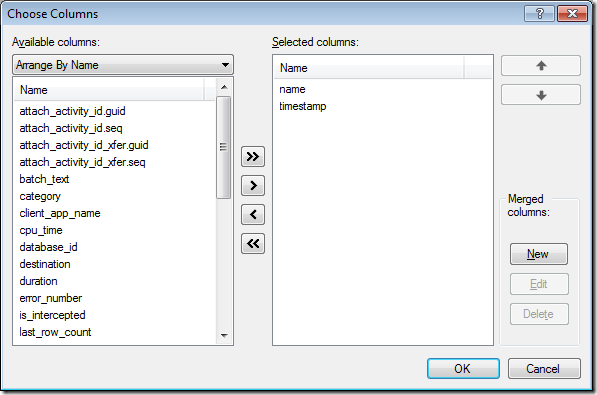
The Choose Columns menu items will open up a column chooser dialog that allows you to add one or multiple columns to the gridview. You can also change the column order in the gridview by selecting a column and clicking the up and down arrows to position the column appropriately in the list.
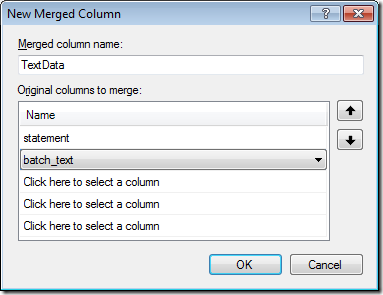
One functionality that you only get inside of the column chooser, is the ability to create a Merged Column for display. This allows you to take columns with different names but similar meaning, for example the statement column produced by the sql_statement_completed event and the batch_text column produced by the sql_batch_completed event, and display them in a single column to maximize the available real estate on the screen and simplify analyzing the data.
After creating the merged column, and adding a number of additional columns to the gridview, we now have a much more recognizable view of the data being generated by our Event Session.
Saving the display for future use
If we close out the Live Data Viewer, Management Studio will remember the layout that we last used with this Event Session the next time we open it against this server. However, if this Event Session is something that we are going to regularly use across multiple servers in our environment, or if we have multiple session definitions that leverage similar sets of events with different parameters configured the gridview layout won't default back to our settings in every scenario. For this reason, you can save the display settings so that you don't have to customize the UI repeatedly. This can be accomplished from the Extended Events menu or toolbars Display Settings item.
Filtering Live Data
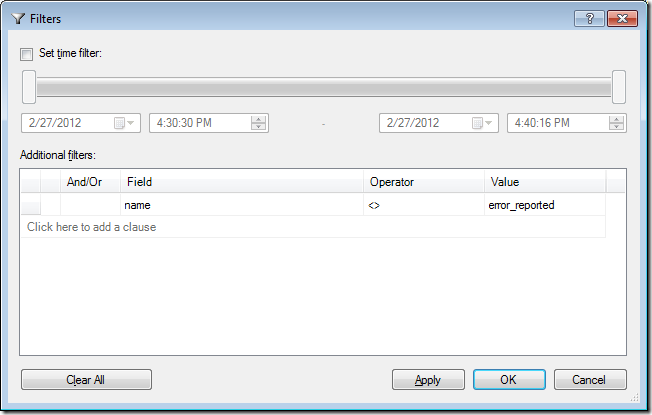
While the Event Session is running, the UI can be used to filter the event data in the grid view on the client side, allowing you to limit the amount of information that is currently being displayed without actually having to change what is being collected by the Event Session in the targets.
These are just some of the more basic features of using the Live Data view inside of SQL Server 2012 for Extended Events. In the next post we'll take a look at some of the additional features that exist for working with data stored in files or when the Live Data viewer is in a disconnected state.




4 thoughts on “SQL Server 2012 Extended Events Update – 3 – Viewing Target Data”
Jonathan,Thanks for the post, Is there any performance impact of using the live data viewer Like the profiler trace?
Thanks
Jay
Hey Jay,
I have another blog post that I am running tests on that will show this, but the answer is no. If you generate a significant enough events and the live data viewer gets behind, it will actually be disconnected by the engine. More details and a full test harness for performance comparisons will be in a coming post that shows this.
Nice Post..Jonathan
Great post , Jonathan .