Have you ever wondered if Extended Events is affecting the performance of your workload? I have written a lot about Extended Events and have been a huge promoter of why you should be using Extended Events instead of SQL Trace for longer than I have worked at SQLskills.com. While Extended Events provides a lot of benefits to data collection with minimal overhead, there are still cases where observation overheads exist when collecting data even with Extended Events.
Measuring “Observer Overhead” of SQL Trace vs. Extended Events – SQLPerformance.com
SQL Server 2022 offers a new feature enhancement to Extended Events that allows it to now track the performance and publishing metrics of the events that have been enabled in an event session that is running on the server. Four new columns were added in the sys.dm_xe_session_events DMV in SQL Server 2022 that provide additional information about the event publishing performance metrics when an event session is running:
Check It Out!
SQL Server Jumpstart+ Bundle
$4,070.00 Original price was: $4,070.00.$999.00Current price is: $999.00.
| Column name | Data type | Description |
|---|---|---|
| event_fire_count | bigint | The number of times the event has fired (was published) since the session was started. Is not nullable. Applies to SQL Server 2022 (16.x) and later. |
| event_fire_average_time | bigint | The average time taken to publish the event, in microseconds. Is not nullable. Applies to SQL Server 2022 (16.x) and later. |
| event_fire_min_time | bigint | The minimum time taken to publish the event, in microseconds. Is not nullable. Applies to SQL Server 2022 (16.x) and later. |
| event_fire_max_time | bigint | The maximum time taken to publish the event, in microseconds. Is not nullable. Applies to SQL Server 2022 (16.x) and later. |
Two of the new columns, event_fire_count and event_fire_average_time, require that you enable Trace Flag 9708 for collection, which is documented in the Books Online:
Trace Flags (Transact-SQL) – SQL Server | Microsoft Learn
These columns will not be populated without the trace flag turned on. The trace flag is global only, so it must be enabled with DBCC TRACEON(9708, -1). I took a look at the output of the following query without the trace flag enabled, and then again with it turned on:
SELECT s.name AS session_name,
	event_name,
	event_fire_count,
	event_fire_average_time,
	event_fire_min_time,
	event_fire_max_time
FROM sys.dm_xe_sessions AS s
INNER JOIN sys.dm_xe_session_events AS xse
	ON s.address = xse.event_session_address
ORDER BY event_fire_max_time DESC


The trace flag is global only, so it must be enabled with DBCC TRACEON(9708, -1). While this system doesn’t have a huge workload running against it constantly, it is good to see that the overall impact of the default event sessions is quite low.
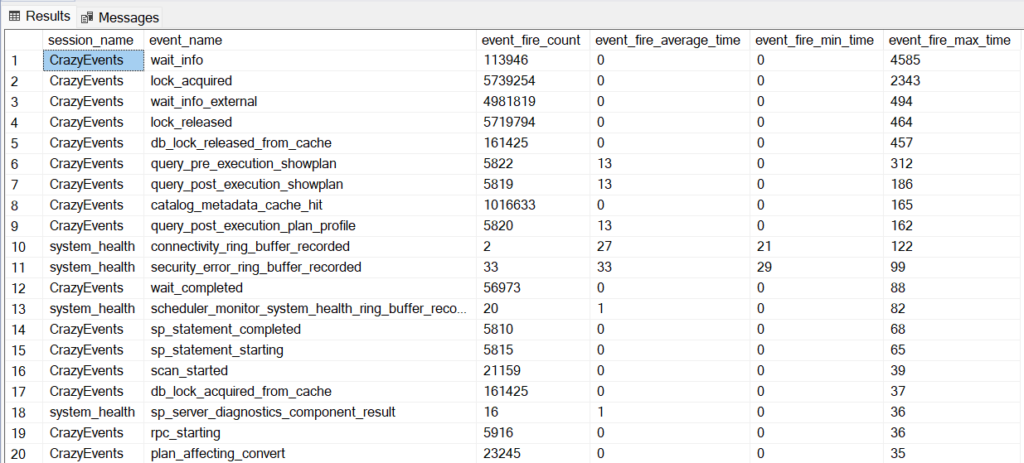
However, I wanted to play around and do something incredibly stupid with this trace flag, so I created an event session on the same server named CrazyEvents, and did a SELECT ALL in the UI and added every non-debug channel event to the session and started it. I won’t be including a script for this, it’s a stupid idea to do to begin with and you can easily reproduce the session in the UI if you want to join me in the nuthouse. Be prepared to wait a few seconds to minutes while it adds that many events to the session though. I will note that editing the event session definition later in SSMS was sufficient enough to turn my laptop fans on.
I was a little surprised by the results of this on a relatively quiesced system where the only queries being executed were related to creating this blog post. I didn’t expect 4.5ms of fire time for the wait_info event to pop up as the longest firing event from a relatively quiesced system.

While I don’t know that I would actually need to turn on the trace flag for the additional two columns, I do think that it is amazing that Microsoft has continued to invest in enhancements to Extended Events that allow for better diagnostics of the performance impacts caused by certain event sessions and the events being collected. Prior to the inclusion of these enhancements, there was no definitive means of determining if an event was impacting performance negatively and by how much aside from observation of behaviors with and without the event session running. Now there is a definitive means of determining whether an event is impacting performance negatively.

