Azure Data Studio, which used to be called SQL Operations Studio, has a bunch of extensions available, including one called Server Reports from Microsoft. Last year they took my wait stats query (from here) and made it into a report as part of Server Reports extension. In this quick post I’ll show you how to install that extension and look at the report.
I’ve been using Azure Data Studio a lot as part of working with SQL Server 2017 on Linux in Azure and I like it a lot. It’s obviously not as comprehensive as SSMS, but for simple stuff it does the job.
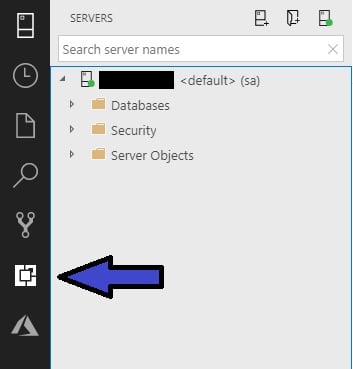
You can see the pretty big list of available extensions by hitting the Extensions icon:
Check It Out!
SQLskills Complete Short Course Bundle
$4,575.00 Original price was: $4,575.00.$899.00Current price is: $899.00.
In the list that appears, find the Server Reports extension and click the Install button:
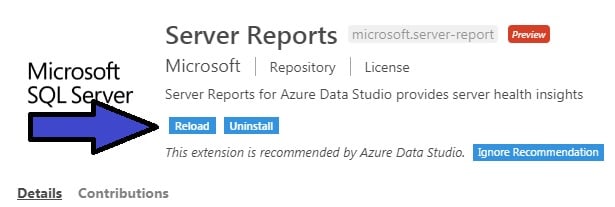
Once an extension is installed, you need to activate it. Without reading any documentation, the first time I used Azure Data Studio I couldn’t figure out why the extension wasn’t there once I’d installed it. Click the Reload button to active the extension:
The extension will now show up in the list of enabled extensions:
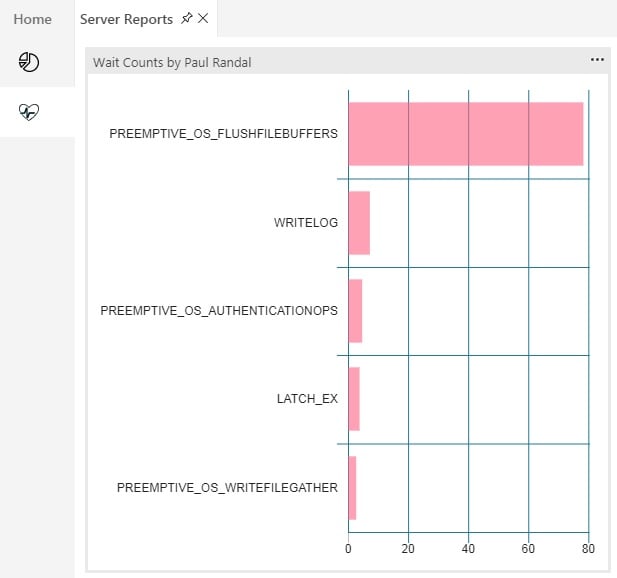
If the Server Dashboard screen isn’t showing, right-click on one of the servers you’re connected to and select Manage. All the active extensions will show as tabs at the top of the screen, so select Server Reports and then click the heart-shaped icon and you’ll see the current aggregate wait stats for the instance:
Note that the x-axis is percentage of all waits, not wait count. You’ll see that PREEMPTIVE_OS_FLUSHFILEBUFFERS is the top wait on my Linux instance – that’s by design and I’ll blog about that next. I’ve also submitted a GitHub change to add that wait to the list of waits filtered out by script the extension uses.
Anyway, you can drill in to the details by clicking the ellipsis at the top-right of the graph and selecting ‘Show Details’. That’ll give all the waits and by selecting each one you can see the usual output from my waits script. To get more information on what each wait means, select the bottom cell, right-click on the URL to copy it, and paste into your favorite browser to go to my waits library. And of course, you can refresh the results via the ellipsis as well.
There are many more useful extensions that you should check out too – enjoy!


7 thoughts on “Using the Wait Statistics Report in Azure Data Studio”
This tool, is starting to look more and more interesting
Thank you Paul for tremendous superb reports.
I am getting Startup_dependency_manager as top waits. Is it worrisome pls
Haven’t seen that one so I don’t know I’m afraid.
This is awesome…My report shows SOS_WORK_DISPATCHER as the top wait. Going through your document, you state that this is pretty benign and you usually remove it. Can this be added to the report?
I’ll try to get to it next week – thanks
Will this work with azure sql paas (elastic pool)
No idea – give it a try!