One of the actions inside of Extended Events is the package0.callstack and the only description provided by sys.dm_xe_objects for the object is 16-frame call stack. If you look back at The system_health Session blog post, you’ll notice that the package0.callstack Action has been added to a number of the Events that the PSS team thought were of significance to include in the Event Session. We can trigger an event that will by logged by our system_health Event Session by raising an error of severity >=20 with the RAISERROR functionality in TSQL.
-- Generate a Severity 20 Error to trigger system_health
-- sqlserver.error_reported Event
RAISERROR(50001, 20, 1, 'This is an Error!') WITH LOG
After raising the error, we can query the system_health Event Session for the callstacks that have been collected by adding into our XQuery a filter for the action node with the @name attribute = “callstack”
SELECT n.query('.') AS callstack
FROM
(
    SELECT CAST(target_data as xml)
    FROM sys.dm_xe_sessions AS s
    INNER JOIN sys.dm_xe_session_targets AS t
        ON s.address = t.event_session_address
    WHERE s.name = 'system_health'
      AND t.target_name = 'ring_buffer'
) AS src (target_data)
CROSS APPLY target_data.nodes('RingBufferTarget/event/action[@name="callstack"]') as q(n)
This will only return the action nodes for the callstack and the XML fragment will be similar to the following:
    <action name="callstack" package="package0">
      <type name="callstack" package="package0" />
      <value>0x0000000001CD4F55
0x000000000113A310
0x0000000000BEA7D0
0x0000000001A3A0CC
0x0000000002FA3EAE
0x0000000000BC9616
0x0000000000BCABBB
0x0000000000BCA4D9
0x0000000000BCD10B
0x0000000000BC7C9B
0x0000000000B6163B
0x0000000000B612FA
0x0000000000B60E35
0x00000000010E0E50
0x00000000010E09A0
0x00000000010F9AB0</value>
      <text />
    </action>
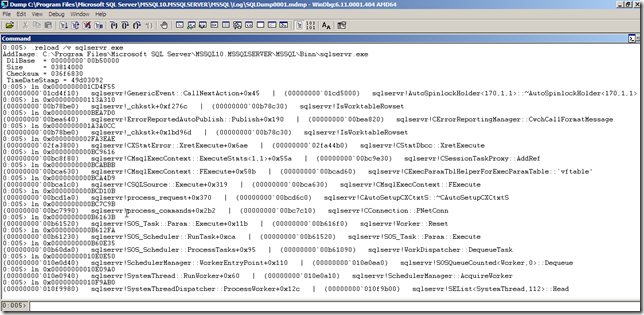
So what is it about this information that would make it important enough to collect? The callstack provides the most recent 16 frames inside of the sqlservr process. If you create a dump file of the sqlservr process using sqldumper.exe, you canopen the mdmp file up in windbg, load the public symbols for sql Server, and then walk the stack with the ln <stack address> command. For example the above callstack resolves in windbg as:
(00000000`01cd4f10) sqlservr!GenericEvent::CallNextAction+0x45 | (00000000`01cd5000) sqlservr!AutoSpinlockHolder<170,1,1>::~AutoSpinlockHolder<170,1,1>
(00000000`00b78be0) sqlservr!_chkstk+0xf276c | (00000000`00b78c30) sqlservr!IsWorktableRowset(00000000`00bea640) sqlservr!ErrorReportedAutoPublish::Publish+0x190 | (00000000`00bea820) sqlservr!CErrorReportingManager::CwchCallFormatMessage
(00000000`00b78be0) sqlservr!_chkstk+0x1bd96d | (00000000`00b78c30) sqlservr!IsWorktableRowset
(00000000`02fa3800) sqlservr!CXStmtError::XretExecute+0x6ae | (00000000`02fa44b0) sqlservr!CStmtDbcc::XretExecute
(00000000`00bc8f80) sqlservr!CMsqlExecContext::ExecuteStmts<1,1>+0x55a | (00000000`00bc9e30) sqlservr!CSessionTaskProxy::AddRef
(00000000`00bca630) sqlservr!CMsqlExecContext::FExecute+0x58b | (00000000`00bcad60) sqlservr!CExecParamTblHelperForExecParamTable::`vftable’
(00000000`00bca1c0) sqlservr!CSQLSource::Execute+0x319 | (00000000`00bca630) sqlservr!CMsqlExecContext::FExecute
(00000000`00bcd1a0) sqlservr!process_request+0x370 | (00000000`00bcd6c0) sqlservr!CAutoSetupCXCtxtS::~CAutoSetupCXCtxtS
(00000000`00bc7990) sqlservr!process_commands+0x2b2 | (00000000`00bc7c10) sqlservr!CConnection::PNetConn
(00000000`00b61520) sqlservr!SOS_Task::Param::Execute+0x11b | (00000000`00b616f0) sqlservr!Worker::Reset
(00000000`00b61230) sqlservr!SOS_Scheduler::RunTask+0xca | (00000000`00b61520) sqlservr!SOS_Task::Param::Execute
(00000000`00b60da0) sqlservr!SOS_Scheduler::ProcessTasks+0x95 | (00000000`00b61090) sqlservr!WorkDispatcher::DequeueTask
(00000000`010e0d40) sqlservr!SchedulerManager::WorkerEntryPoint+0x110 | (00000000`010e0ea0) sqlservr!SOSQueueCounted<Worker,0>::Dequeue
(00000000`010e0940) sqlservr!SystemThread::RunWorker+0x60 | (00000000`010e0a10) sqlservr!SchedulerManager::AcquireWorker
(00000000`010f9980) sqlservr!SystemThreadDispatcher::ProcessWorker+0x12c | (00000000`010f9b00) sqlservr!SEList<SystemThread,112>::Head
This information isn’t really of much use unless you have access to or understand the SQL Server Source code. In the event that you have an issue, the PSS team can create a memory dump of the process, collect the output from the ring_buffer target, and walk the stack to see what lead to the Event firing.
It is possible to materialize the stack without having to actually perform a memory dump and without using windbg. In the SQLCAT team blog post Resolving DTC Related Waits and Tuning Scalability of DTC, Trace Flag 3656 is documented as materializing the callstack if the sqlservr.pdb symbols file exists in the same directory as sqlservr.exe.
NOTE: There is a reason that this functionality is not turned on by default in SQL Server. It is not recommended that you enable this Trace Flag on a production server unless directed to do so by PSS as a part of a support case. This Trace Flag can impact performance and should not be used lightly.
In SQL Server 2008, the symbols file is not included by default in the product. To get the symbols file, you can use windbg and a memory dump. For steps on how to do this, see http://blogs.msdn.com/b/askjay/archive/2009/12/29/basic-debugging-concepts-and-setup.aspx. Once you open the memory dump file for the first time, the symbols are downloaded from the public symbols server and placed in the .sympath specified, in the case of the blog post mentioned it will be C:\symbols\public\sq\sqlservr.pdb\1E7168D2F78B4FBA911F507689D7DE902. After copying the pdb to the Binn folder for the SQL instance, by default C:\Program Files\Microsoft SQL Server\MSSQL10.MSSQLSERVER\MSSQL\Binn, we can turn on the trace flag and requery our Event Session.
--Trace flag 3656 enables the call stacks to be resolved.  This requires that the
--sqlservr.pdb file reside in the same directory as sqlservr.exe
DBCC TRACEON (3656, -1)
GO
SELECT n.query('.') AS callstack
FROM
(
    SELECT CAST(target_data as xml)
    FROM sys.dm_xe_sessions AS s
    INNER JOIN sys.dm_xe_session_targets AS t
        ON s.address = t.event_session_address
    WHERE s.name = 'system_health'
      AND t.target_name = 'ring_buffer'
) AS src (target_data)
CROSS APPLY target_data.nodes('RingBufferTarget/event/action[@name="callstack"]') as q(n)
The output of our callstack action is now:
<action name="callstack" package="package0"> <type name="callstack" package="package0" /> <value>GenericEvent::CallNextAction+45 [ @ 0+0x0 _chkstk+f276c [ @ 0+0x0 ErrorReportedAutoPublish::Publish+190 [ @ 0+0x0 _chkstk+1bd96d [ @ 0+0x0 CXStmtError::XretExecute+6ae [ @ 0+0x0 CMsqlExecContext::ExecuteStmts<1,1>+55a [ @ 0+0x0 CMsqlExecContext::FExecute+58b [ @ 0+0x0 CSQLSource::Execute+319 [ @ 0+0x0 process_request+370 [ @ 0+0x0 process_commands+2b2 [ @ 0+0x0 SOS_Task::Param::Execute+11b [ @ 0+0x0 SOS_Scheduler::RunTask+ca [ @ 0+0x0 SOS_Scheduler::ProcessTasks+95 [ @ 0+0x0 SchedulerManager::WorkerEntryPoint+110 [ @ 0+0x0 SystemThread::RunWorker+60 [ @ 0+0x0 SystemThreadDispatcher::ProcessWorker+12c [ @ 0+0x0</value> <text /> </action>
If you note, these match up to the stack output from windbg. If you are interested in trying to figure out the internal stack of SQL Server, the package0.callstack event can certainly be useful, but in general it is not something that you will get much use of in general troubleshooting with Extended Events.


