Last week someone sent Kimberly an email asking what the read_microsec column in the sys.dm_os_buffer_descriptors DMV in SQL Server 2012 showed. The email was passed around our team and to be honest it was the first time I’d even heard of the column existing. The questioner also wanted to know if/how the read_microsec column be used. The Books Online topic for sys.dm_os_buffer_descriptors defines this column as, “The actual time (in microseconds) required to read the page into the buffer. This number is reset when the buffer is reused.”
This would make you think that the counter is per-page in the buffer pool, but I wanted to see what exactly it correlates to, and the results aren’t quite as straightforward as the Books Online description might seem. The read_microsec column isn’t the time required to read a single page in microseconds – it’s the time taken to complete reading into the buffer pool the original I/O block that the page was part of – whether that block was a single 8KB page or a much larger I/O. This is a completely different meaning when you think about the different sizes of I/O that SQL Server can potentially do.
Investigating this further
To look at this further, the first thing to do is identify the Page ID for a specific row in a database that we can use for tracking the I/O associated with bringing that page into the buffer pool. To do this, we can use the fn_PhysLocFormatter function and %%physloc%% as shown by Paul in his blog post, SQL Server 2008: New (undocumented) physical row locator function.
SELECT TOP 1
	sys.fn_PhysLocFormatter(%%physloc%%) AS [Physical_Loc],
	*
FROM AdventureWorks2012_Slow.Production.Product
ORDER BY ProductID;
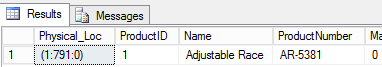
In my copy of AdventureWorks2012, this returns Page ID 791, as shown in the screenshot above. Using this Page ID we can clear the buffer pool with DBCC DROPCLEANBUFFERS and then rerun our query to read the page back into the buffer pool from disk. However, since we want to track what the meaning of the new column in sys.dm_os_buffer_descriptors is, first let’s create an Extended Events session to track the physical I/O operations and memory operations associated with the session_id that we are running our queries on.
CREATE EVENT SESSION [PageIOLatency]
ON SERVER
    ADD EVENT sqlos.async_io_completed
        (WHERE (sqlserver.session_id=55)),
    ADD EVENT sqlos.async_io_requested
        (WHERE (sqlserver.session_id=55)),
    ADD EVENT sqlos.page_allocated
        (WHERE (sqlserver.session_id=55)),
    ADD EVENT sqlos.page_freed
        (WHERE (sqlserver.session_id=55)),
    ADD EVENT sqlserver.file_read
        (WHERE (sqlserver.session_id=55)),
    ADD EVENT sqlserver.file_read_completed
        (WHERE (sqlserver.session_id=55)),
    ADD EVENT sqlserver.physical_page_read
        (WHERE (sqlserver.session_id=55)),
    ADD EVENT sqlserver.sql_statement_completed
        (WHERE (sqlserver.session_id=55)),
    ADD EVENT sqlserver.sql_statement_starting
        (WHERE (sqlserver.session_id=55))
    ADD TARGET package0.event_file
        (SET filename=N'PageIOLatency.xel')
WITH (TRACK_CAUSALITY=ON);
Now we can clear the buffer pool, start the event session, query the row from the Production.Product table, and then stop the event session and review the information contained in the event_file target. Specifically we want to look at the I/O operations for page_id 791 and what the duration was for reading the page.
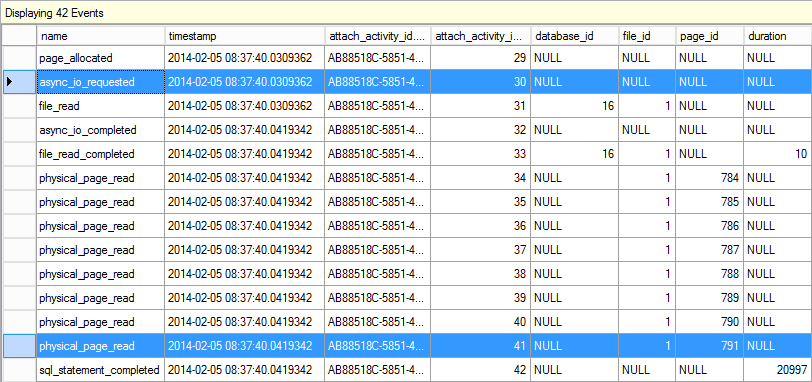
Here I’ve highlighted the async_io_requested event and the last physical_page_read event associated with the I/O for page_id 791. If we look at the duration of the file_read_completed event, which is in milliseconds, we can see from the image above that it took 10 milliseconds to perform the read operation. The read_microsec column in sys.dm_os_buffer_descriptors is in microseconds, so this may only loosely correlate to the value showing for page_id 791 when we query dm_os_buffer_descriptors.
SELECT
	obd.file_id,
	obd.page_id,
	obd.page_level,
	obd.row_count,
	obd.free_space_in_bytes,
	obd.is_modified,
	obd.numa_node,
	obd.read_microsec
FROM sys.dm_os_buffer_descriptors AS obd
WHERE database_id = DB_ID('AdventureWorks2012_Slow')  AND
	obd.page_id = 791;
If we look at the timestamps for the async_io_requested and async_io_completed events in the event_file output, we can calculate out the delta in microseconds between the I/O request posting and the completing:
2014-02-05 08:37:40.0419342 — async_io_completion timestamp
2014-02-05 08:37:40.0309362 — async_io_requested timestamp
010998 — delta in microseconds
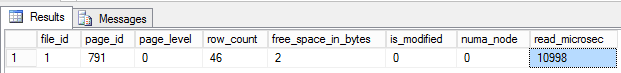
This is an exact match to the read_microsec in sys.dm_os_buffer_descriptors, which proves that the column provides the actual I/O time associated with that page being read into the buffer pool.
However, it is not actually that simple…
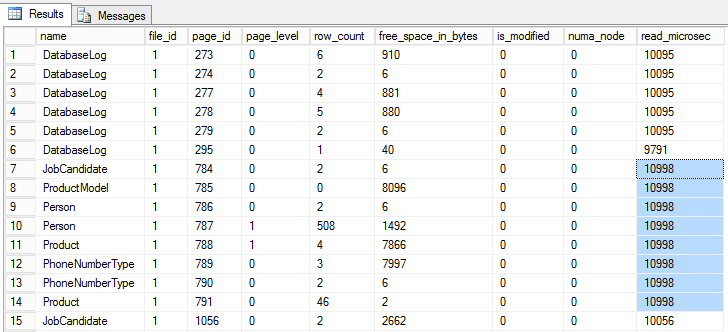
If we go back to the event_file results, we’ll notice that we didn’t just read one page into the buffer pool with our request, we read an entire extent, 8 pages, into the buffer pool with our I/O operation. So if we modify our query against sys.dm_os_buffer_descriptors to show all of the pages for the AdventureWorks2012_Slow database, we’ll see that all 8 of the pages that were read in a single read, have the same read_microsec value.
SELECT
	o.name,
	obd.file_id,
	obd.page_id,
	obd.page_level,
	obd.row_count,
	obd.free_space_in_bytes,
	obd.is_modified,
	obd.numa_node,
	obd.read_microsec
FROM sys.dm_os_buffer_descriptors AS obd
JOIN AdventureWorks2012_Slow.sys.allocation_units AS au
	ON obd.allocation_unit_id = au.allocation_unit_id
JOIN AdventureWorks2012_Slow.sys.partitions AS p
	ON au.container_id = p.partition_id
JOIN AdventureWorks2012_Slow.sys.objects AS o
	ON p.object_id = o.object_id
WHERE database_id = DB_ID('AdventureWorks2012_Slow')  AND
	o.is_ms_shipped = 0
ORDER BY obd.page_id, o.name, obd.read_microsec;
So for a single page, unless it is a single 8KB read that occurred, the read_microsec column doesn’t necessarily show an I/O related problem. We’d have to know the size of the original I/O block that read the page into the buffer pool to know if the amount of read_microsec is actually a problem. The reason for this is that with I/O latency, the size of the I/O operation performed matters. Larger block I/Os take longer to complete than smaller blocks. To demonstrate this, we can perform a query that would perform larger read-ahead reads from the data file and look at the impact to the read_microsec column for the pages that are read in the larger block I/O.
To do this, I used the sys.fn_PhysLocCracker() TVF in a CROSS APPLY against the Sales.SalesOrderDetail table to find the first set of contiguous rows in the table. Using the query below, this happened to be the TOP 2866 in my AdventureWorks2012_Slow database which covered 32 pages contiguously or 256KB starting at page_id 10672 and ending at page_id 10703.
SELECT *
FROM AdventureWorks2012_Slow.Sales.SalesOrderDetail
CROSS APPLY sys.fn_PhysLocCracker(%%physloc%%);
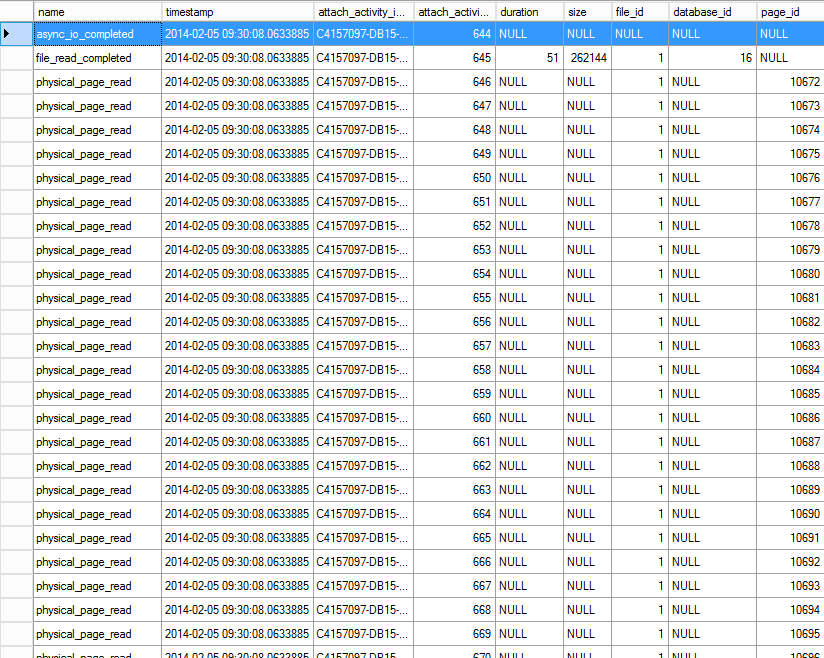
So if we start the event session again, clear the buffer pool, and read the TOP 2866 rows from the Sales.SalesOrderDetail table, the event data will show that all 32 pages were read with a single 256KB read-ahead read, and the duration for the file_read_completed event is 51ms.
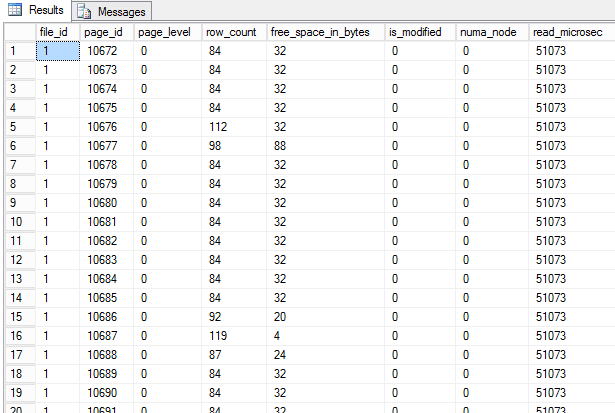
If we look at the information in the read_microsec column for the 32 pages in sys.dm_os_buffer_descriptors after reading the table, we’ll see again that all of the pages have the same value.
SELECT
	obd.file_id,
	obd.page_id,
	obd.page_level,
	obd.row_count,
	obd.free_space_in_bytes,
	obd.is_modified,
	obd.numa_node,
	obd.read_microsec
FROM sys.dm_os_buffer_descriptors AS obd
WHERE database_id = DB_ID('AdventureWorks2012_Slow')  AND
	obd.page_id BETWEEN 10672 AND 10703
ORDER BY page_id
Summary
The read_microsec column of sys.dm_os_buffer_descriptors wouldn’t be my first go-to metric for looking at I/O latency or page-read issues in SQL Server. While the screenshots in this blog post showed that consecutive page_ids retrieved by a single I/O operation have the same read_microsec value, the testing was done on a SQL Server with no other load and doesn’t mimic production activity in any way. In a production server, you can’t rely on looking at consecutive pages in the output of sys.dm_os_buffer_descriptors to correlate whether or not the pages were all read at the same time in most cases. This is especially true if the server has experienced buffer pool memory pressure or has been active for a long period of time, since pages that aren’t actively being used may be removed to make space for new pages being read into the buffer pool, and a single page within a larger block of pages may remain in the buffer pool longer than the pages around it.
For troubleshooting I/O latency problems, I’d recommend reading Erin’s blog post on Monitoring Disk I/O from our Accidental DBA series, which covers other methods for looking at I/O latency including sys.dm_io_virtual_file_stats and the Physical Disk performance counters.