(For the hardware setup I’m using, see this post.)
As part of my new benchmarking series I first wanted to play around with different configurations of data files and backup files for a 1-TB database to see what kind of performance gains I can get invoking the parallelism possible when backing up and restoring the database. To do that I need a way to quickly populate a 1-TB database so that I can mess around with different numbers of files and so on. It doesn’t matter what the data in the database is, as backup doesn’t care – as long as there’s a terabyte of it. Why a terabyte? It’s a nice round number, it’s a common enough database size right now, and I have the storage to play around with it.
But then my plans got derailed. In figuring out how to most quickly populate a 1-TB database, I realized that in itself would be an interesting benchmark to explore, so that’s what I’m doing first.
My aim is to give you improvements you can use in real life. If you think this is going to be boring, skip down to the end of the post where I show a detailed perfmon and explain what’s going on in my overloaded IO subsystem, then come back up here :-)
The baseline for this benchmark is contrived – I’m going to populate a 1-TB clustered index (so I can do other experiments with the index) as quickly as I can. The interesting part is that I’m starting with a brain-dead database layout, configuration, and method of populating the table, and then I’m going to alter different things to see the effect on the system. The effects and gains will be the interesting part as it will expose parts of how SQL Server works which *WILL* be applicable to real-life situations and workloads – the whole point of me doing all of this is to show you improvements, why they work, and how they could be useful to you.
When doing any kind of performance testing it’s *essential* to have a baseline with which to compare – otherwise how do you know what effect a variation is having? This post describes my baseline setup, measurements, and limitations I start to notice.
First let me describe the baseline setup:
- Single data file and log file stored on the same volume, on an 8-drive RAID-10 array (each drive is a 300GB 15k SCIS drive), connected through iSCSI to the server
- Data file is created to be 1-TB, with instant file initialization enabled
- Log file is created to be 256MB
- Database is using the SIMPLE recovery model
Yes, I’m deliberately putting the data and log on the same RAID array. I *want* to see some contention so I can prove to you how separation of data and log can reduce contention and improve performance sometimes.
Database and table creation script:
CREATE DATABASE [BackupPerfTest]
ON
    (NAME = N'BackupPerfTest_Data',
    FILENAME = N'K:\BackupPerfTest.mdf',
    SIZE = 1TB,
    FILEGROWTH = 1GB)
LOG ON
    (NAME = N'BackupPerfTest_Log',
    FILENAME = N'K:\BackupPerfTest.ldf',
    SIZE = 256MB,
    FILEGROWTH = 50MB);
GO

ALTER DATABASE [BackupPerfTest] SET RECOVERY SIMPLE;
GO

USE [BackupPerfTest];
GO

CREATE TABLE [MyBigTable] ([c1] BIGINT IDENTITY, [c2] CHAR (4100) DEFAULT 'a');
GO
CREATE CLUSTERED INDEX [MyBigTable_cl] ON [MyBigTable] ([c1]);
GO
I figured the fastest way to fill the database is to have a single table with one row per page, and that having SQL Server create the large CHAR column inside itself, rather than me doing a REPLICATE, would be quickest.
For the actual population of the table, I worked out that 134,217,728 table rows gives me a terabyte, with each row taking up a single 8KB page.
The baseline setup of the table population is:
- Varying numbers of concurrent connections (16, 32, 64, 128, 256) to the server (8-way DELL PowerEdge 1950)
- Each connection runs a simple script that inserts 134,217,728 / number-of-connections rows into the table, and then logs the elapsed time into a results table
- Each insert is done as a single-statement implicit transaction (if I don’t do an explicit BEGIN TRAN/COMMIT TRAN, SQL Server does it for me)
- A monitor connection pings the results table every 5 minutes checking to see if number-of-connections results are there, and sending me email if so
Yes, I’m deliberately using this method to insert each row. Again, I want to be able to make improvements and see the effect of the changes.
Each connection will be running this script:
SET NOCOUNT ON;
GO

DECLARE @counter BIGINT;
DECLARE @start   DATETIME;
DECLARE @end     DATETIME;

SELECT @counter = 0;
SELECT @start = GETDATE ();

WHILE (@counter < $(rows))
BEGIN
INSERT INTO [MyBigTable] DEFAULT VALUES;
SELECT @counter = @counter + 1;
END;

SELECT @end = GETDATE ();

INSERT INTO [msdb].[dbo].[Results] VALUES (CONVERT (INTEGER, DATEDIFF (second, @start, @end)));
GO
[/sourcecode

This is run through SQLCMD, and the number of rows to insert is passed into the T-SQL script using:

sqlcmd -S(local)\SQLDev01 -dBackupPerfTest -i"C:\SQLskills\Populate1TBTest\PopulateTable.sql" -v rows=%1
%1 in the line above is passed from a master CMD that kicks off number-of-connections CMD windows, each of which just runs the SQLCMD line above.
So – a simple setup.
Here’s a graph of the results:
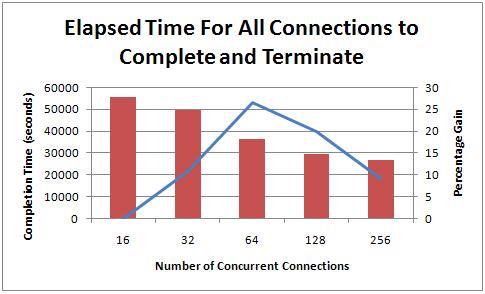
The elapsed times for all connections to complete their work (as there could be up to an hour between the first and last to complete) were:
- 16-way: 15 hours 25 minutes 5 seconds
- 32-way: 13 hours 50 minutes 18 seconds (11% faster)
- 64-way: 10 hours 12 minutes 48 seconds (27% faster)
- 128-way: 8 hours 8 minutes 27 seconds (20% faster)
- 256-way: 7 hours 24 minutes 21 seconds (9% faster)
More connections clearly leads to a faster run time, but the improvements from doubling the number of threads clearly aren’t directly proportional to the number of threads. The biggest improvement was from 32 to 64 threads, and then the percentage gain started to tail off. Let’s look at the page allocations per second for each experiment too:
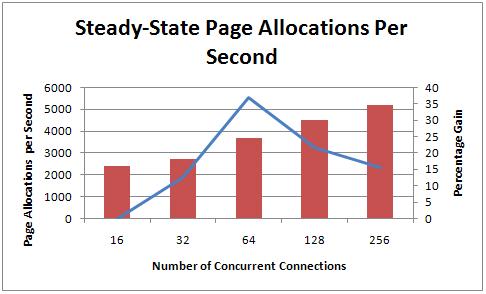
As I’d expect, the pace at which pages are being allocated in the database increases with more threads and the percentage improvements line pretty much matches that of the elapsed time graph above. There’s a slight difference in the 128 and 256 gains here because the graph is show what the perf counter number was after the experiment reached a steady state. I noticed that the log grew enormously for the last few tests, which caused the steady-state number to not be reached for a while. I’ve already blogged about that phenomenon in Interesting case of watching log file growth during a perf test.
I also watched what was happening in perfmon to see if there were any obvious performance problems going on. Here’s a perfmon graph for the 64-way test once it reached steady-state and the log wasn’t growing:
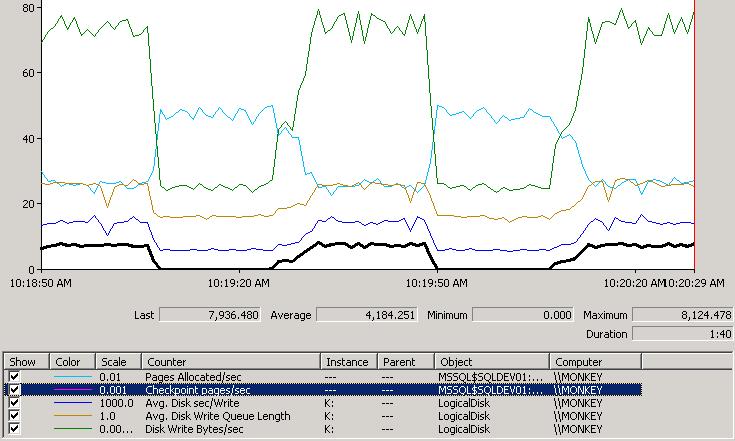
Analysis:
- The black line is above 0 when a checkpoint is occuring.
- The green line represents how much data is being written to the K: volume, where the data and log file are. You can see there’s a constant amount of data being written all the time (transaction log records when the implicit transactions commit) with large spikes whenever a checkpoint occurs and causes the actual data pages to be written out.
- The light blue line is the pages allocated per second. You can see that it takes a major nose dive whenever a checkpoint occurs. I’m speculating that this is because of disk contention preventing the transaction log being written to disk (thus slowing down the transaction throughput) while the checkpoint is occuring and writing out data pages
- The dark blue line at the bottom is the average disk seconds per write. You can see that it hovers around 4-5 milliseconds and spikes to 16-17 when a checkpoint occurs.
- The brown line in the middle is the average disk write queue length. It hovers around 18-19 and spikes to around 25 when a checkpoint occurs.
Observations:
- This system is clearly bottlenecked in the I/O subsystem
- There is a direct correlation between checkpoints occuring and: increased disk queue length, reduced transaction throughput
This is what I would expect to see on a system with lots of updates where the log and data are on the same volume. Remember that I’ve got them on a fast RAID-10 array. This debunks the theory I’ve often heard that contention doesn’t matter on RAID arrays. Yes, it does. You can still max out the throughput capabalities of any IO subsystem – it just depends what you’re trying to do with it. Imagine if I had nonclustered indexes on this table too – more logging and more pages being allocated – much worse performance…
So now I’ve got my baseline and there are some obvious things I can try to improve things:
- Data and log file separation
- Varying number of data files
- Varying placement of data files (e.g. different RAID arrays)
- Manual checkpoints
- Pre-sizing the log
- Using explicit transactions with varying batch insert sizes
- Using -E to get larger allocations
I’m not saying that all of these things are going to help, but over the next few weeks I’m going to try them all and report on the results. You’ll be able to clearly see the effect of changing these on my benchmark, running on production-quality hardware, rather than just taking people’s words for it.
I hope you’re going to find these benchmarks and experiments useful – I’ll be learning (hopefully) as I go along too.
Let me know if there’s anything else you’d like to see me try, and if you’re following along (I don’t want to spend all this time if no-one’s reading the series!)
Thanks!
31 thoughts on “Benchmarking: 1-TB table population (part 1: the baseline)”
Yes, I’m following along. Very interested in what you end up with. I’d be curious to see traceflag 834 and also partitioning the table (provided that you are using SQL 2k8). One thing that I’ve seen success with is using sqlnative format for the source files.
Quick question; when you mention "varying number of data files"; do you mean database data files (partitions) or source files?
I’d also be very interested to see the test run with a primary key on c1 and what the overhead becomes for the constraint.
I’m a watching and a learning…truthfully I will be reading over this post a few times and then maybe I will be ready for the next one :)
I’m following along!
I’m very interested in Data/Log separation, varying number of data files, varying placement of data files, and pre-sizing the log. These are things that I recommend to folks on a regular basis when determining storage architecture for SharePoint farms.
Russ
SharePoint MCM
Yes, following along. Most excited to see your results from file separation, different RAID and explicit transactions – this is all stuff we have to consider when running custom scripts.
Thanks!
I was sad to see this entry end before a configuration change. I’m on the edge of my seat for the next revision.
I’m following!
I’ve replicated a similar test (less up front measurement though and using a one-off .NET app for multiple clients) and have observed similar results.
I’m really looking forward to the varying number of data files and data file placement tests. I’m very interested in the explanation and insight you can offer into what these changes do "behind the scenes".
Please keep up the great work!
-Andrew
Paul,
I’m glad to see you exploring this topic, looks like good stuff! Anything Storage related is great since there’s never enough storage experts around.
As far as things to try, I’d love to see how an SSD plays into things here. If you’ve only got a few SSD’s in your array, what should you do with them? Use them for TempDB, TXLogs, Indexes only, etc. I’m sure like most things "it depends" but I’d love to see some real data to help make these decisions.
Good work, Paul. It might be interesting to run some DMV queries during these tests to look at top waits and I/O specific stuff.
Paul, Great work, Can’t wait to read through it a couple times! :)
Michael — I’m with you I’m currently testing an SSD FusionIO card and think it would be very interesting to see what it will do to this setup. I don’t have near the setup or knowledge that paul does but I will be posting some information on my tests on the drive in the next few days on my blog you can use those SQLIO tests I did as well to compare to things your looking at. I put a SSD on a client box for the tempdb and it really helped with performance.
pat
Hi Paul
Great stuff… You might want to try enabling TF 610 (at the session level) to have your inserts into the clustered index minimally logged. Another option is to add the (TABLOCK) hint to your INSERT statement, but this will only enable minimal logging if your table is empty.
/Michael
was the partition formated with standard block size or the biggest one ? Would it change something ?
It would be interesting to see a raw base line IO system performance (w/ a tools like iometer or HD Tach).
Looks like IO throughput on the system a bit on a low side (~80MB/sec) for 8x15K RAID drives. iSCSI config and ip infrastructure may need some tuning.
– Interesting to see if a "short-stroking" drives in array will make any performance improvement.
– Another interesting test would for the database with PAGE compression enabled.
– Also partitioned table across filegroups/databases (with some hash allocation logic)
@Michael TF610 won’t help as I’m not doing a bulk operation – so it can’t be minimally logged. I’m doing regular inserts which must always be fully logged.
@Mathieu Partition offset was the Windows Server 2008 default of 1MB. RAID stripe size – 128KB. NTFS allocation unit size – 64KB.
@Konstantin A bunch of these things will be forthcoming as we go along.
Thanks everyone!
Grate post as we usualy only se posts for VLDB.. this is more in the ballpark for many Small business.
Quick help with similar HW. HP DL380 with total of 8 146GB 15k drives.
The total size of databases is arround 100GB.
My usual setup is 2 drives in mirror for OS and 6 drives in raid 5 in 2 partitions, 1 data, 1 logs, both formated a 64k block sizes.
I have never had a chance to test different setups then this, but I have been wondering if I could have a better througput having 2 OS mirror, 4 raid 10 for data, 2 for log. Or even 2 OS mirror, 2 data mirror, 2 tempdb mirror, 2 log mirror.
The application is Microsoft Great Pains Database. (ERP)
when you create a new array for the log file will you use the same number of underlying disks for both arrays? ie 8 for both arrays?
Please can you also show any wait states generated between tests?
@baberi01 No – won’t use the same number (or maybe even type) of disks when I split things out. Yes, I’ll be showing wait states too in future.
@juan It totally depends on what you’re doing with the database. RAID5 is not recommended for the log though – no redundancy and you pay a penalty on each write operation. RAID1 or RAID10.
If you planning to look at the backup side of things i’d be interested in seeing ways to increase read throughput from data devices without splitting across multiple disks……
Example Scenario:
2 or more data devices on 1 physical drive
Backing up to a seperate device which has no/minimal write contention. :)
Agree I was reading and when the end came I was already looking to the next batch of findings.
oh, and awesome computer name.
@Andrew That’s the Plan.
This is really interesting!
When you split the disks out, will you have the same total number of disks? Otherwise that would be cheating. ;)
@Clay Yes and no.
Hi Paul,
Thanks you very much for providing the in-depth details in all aspects of SQL Server including the new one Storage.
These days most of the VLDBs are on SAN, so are there any plans to do the same testing on SAN?
Most of the storage experts says no need to separate the files because LUN carving is nothing but vertical partition of the the disks.
Thanks,
Mohammed.
This is excellent! Add me to the list of those who will be following along.
Nope – I don’t have a SAN to play with.
This is insert 10 rows at once:
INSERT MyBigTable (c2)
VALUES(‘a’),(‘a’),(‘a’),(‘a’),(‘a’),(‘a’),(‘a’),(‘a’),(‘a’),(‘a’)
To make it simple just reduce the number of time you call it.
This is awesome, Paul.
I am following along to see all future results. I have been waiting a long time to show some hard evidence about separation log from data, especially when people continuously argue that a big RAID-10 array would suffice for both.
I am looking forward for next benchmark results.
Hi Alex – yes, you should be able to monitor performance at the IO subsystem level. How that’s done is entirely dependent on the hardware vendor. In part 2 of this series you’ll see how I’m doing it for the Del gear I have. And yes, the numbers I get match the perfmon counters I see at the windows level. Thanks!
Hi Paul,
I will follow all your benchmark posts because I think that knowing the relationship between SQL Server and storage is very important to DBAs.
I would like to know if you can monitor storage usage through storage tools and correlate this data with what you see in pefrmon, disk Write Bytes/sec. Would these number be the same or some differences may appear?
Hi Paul, great post! Any chance you could share the master CMD file that kicks off number-of-connections CMD windows for the community to reuse?
It’s actually morphed into a whole test harness with instrumentation that I won’t be blogging, but kicking off multiple connections is really simple – just a set of ‘start blah.cmd’ lines where blah.cmd does the osql connection.