(For the hardware setup I’m using, see this post. For the baseline performance measurements for this benchmark, see this post.)
In my previous post in the series, I described the benchmark I’m optimizing – populating a 1-TB clustered index as fast as possible using default values. I proved to you that I had an IO bottleneck because the IOs to the data file (from checkpoints) and the transaction log file (from transactions committing) were causing contention.
Several people commented that I might have mis-configured the iSCSI IO subsystem – so first off I want to look at that. Fellow MVP Denny Cherry (twitter|blog), who knows a lot more than me about IO subsystems, volunteered to discuss my iSCSI setup with me to make sure I hadn’t goofed anywhere (many thanks Denny!). It seems like I haven’t. I’m using a single iSCSI array right now, with a single NIC on the server dedicated to the iSCSI traffic – once I move to multiple volumes, I’ll add in more NICs.
Looking at Task Manager in the middle of a 6-hour test run to see the network utilization through the NIC shows that it’s not saturated, as shown below.

I ran the DELL smcli utility for two hours during the most recent test to see what peak throughput I’m getting, using the following command:
smcli -n Middle_MD3000 -c "set session performanceMonitorInterval=5 performanceMonitorIterations=1440;save storageArray performanceStats file=\"c:\\MiddlePerfStats.csv\";"
I saw around 101MBytes/sec. and earlier when testing the smcli settings I’d seen 106MBytes/sec. I’m sure once I remove some of the contention that this will get better.
On to the test!
The first thing I wanted to try was optimizing my use of the transaction log – i.e. doing as few and as large I/Os as possible to the log. My hypothesis is that by changing the batch size from one to, say, 10 or 100 SQL Server can make more efficient use of the log.
I changed my T-SQL script to take a batch size parameter and use explicit transactions inserting <batch-size> records. Everything else remained the same as the baseline. I picked 128 concurrent threads as my test point. In the baseline, the 128-thread insert test took 8 hours 8 minutes 27 seconds to complete (29,307 seconds). My simple T-SQL code changed to (with $(rows) and $(batch) being SQLCMD parameters to the script):
DECLARE @counter BIGINT;
DECLARE @inner   SMALLINT;
DECLARE @start   DATETIME;
DECLARE @end     DATETIME;

SELECT @counter = 0;
SELECT @start = GETDATE ();

WHILE (@counter < $(rows))
BEGIN
    SELECT @inner = 0;
    BEGIN TRAN;
    WHILE (@inner < $(batch))
    BEGIN
        INSERT INTO MyBigTable DEFAULT VALUES;
        SELECT @inner = @inner + 1;
    END
    COMMIT TRAN;
    SELECT @counter = @counter + $(batch);
END;

SELECT @end = GETDATE ();

INSERT INTO msdb.dbo.Results VALUES (CONVERT (INTEGER, DATEDIFF (second, @start, @end)));
GO
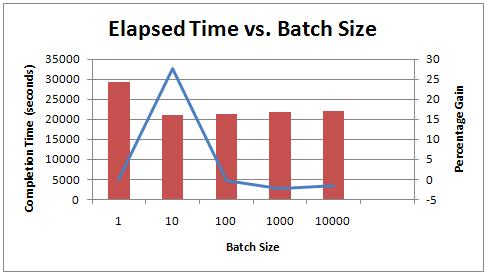
Below are the results for 128 threads with batch sizes varying from 10 to 10,000:

Increasing the batch size from 1 record to 10 records caused the elapsed time to drop from 29,307 seconds to 21,167 seconds – a 28% improvement! However, increasing the batch size further didn’t improve things any more. Hmmm.
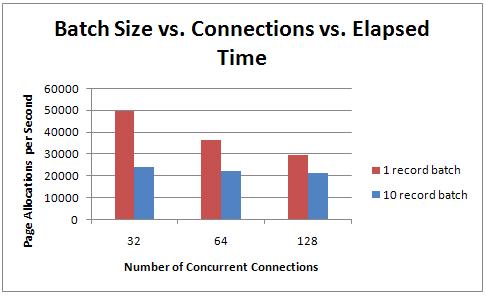
Next I tried different numbers of concurrent connections with a batch size of ten to see if the improvement was universal:

So moving from a single-record batch to a ten record batch has the same dramatic effect on performance for varying numbers of connections.
What’s going on?
The answer involves some deep internals of the transaction log structure and I/O behavior. The transaction log is split up internally into sections called virtual log files (VLFs for short). These VLFs are used to manage which parts of the log can be overwritten with new log records. If this is all unfamiliar, go read my TechNet Magazine article on Understanding Logging and Recovery in SQL Server which explains about the log in more detail and about transactions, otherwise what’s coming next may not make much sense.
Whenever a transaction commits, all the transaction log records up to and including the LOP_COMMIT_XACT log record for that transaction (including log records from other transactions that are inter-mingled with those from the one that just committed) must be written out to disk, so the transaction is durable (called write-ahead logging). But it’s not individual log records that are written to disk, the unit of I/O for the transaction log is a log block. VLFs are split internally into dynamically sized log blocks, ranging from 512-bytes to 60KB in 512-byte increments, as needed. There are algorithms to figure out how big log blocks should be based on what log records are being flushed out.
With the single record batch, the amount of log generated in the transaction totals 4,952 bytes. You can find this by doing something like:
CHECKPOINT;  -- to force the log in the SIMPLE recovery model to clear
GO

INSERT INTO MyBigTable DEFAULT VALUES;
GO

SELECT * FROM fn_dblog (NULL, NULL); -- show me all active log
GO
Then add up the values in the Log Record Length column for all records from the first LOP_BEGIN_XACT log record to the LOP_COMMIT_XACT with the matching Transaction ID.
Anyway, a single-record transaction generates 4,952 bytes of transaction log, which will be flushed out in our case in a log block that’s 5,120 bytes (the nearest multiple of 512 above 4,952), with a bunch of zero-padding at the end. For ten single-record transactions, that’s 10 small I/Os.
The ten-record transaction generates 48,688 bytes of transaction log and will be flushed out in a log block that’s 49,152 bytes (the nearest multiple of 512 above 48,688). This is clearly more efficient than 10 smaller I/Os and is why changing to batches makes things go faster.
A 100-record transaction generates 489,628 bytes of transaction log, which is clearly more than the 60KB log-block maximum, so it actually covers multiple log blocks (varying from 14-16 in my tests – I don’t remember the exact algorithms). You can see the log block changing when the middle number in the Current LSN column of the fn_dblog output increases. It looks like it’s jumping up, and it is – this is the offset of the log block within the current VLF divided by 512.
Because the 100-record transaction is split into multiple log blocks, there’s no real I/O gain during log flushes over the 10-record transaction – which is illustrated by the results I saw.
Now, even with this speed increase from the increased batch size, the average-disk-write-queue-length is still anywhere from 20-40 when running the 128-connection test, so there’s still a significant bottleneck there. In fact, the transaction log grew significantly still during these tests (up to 23GB in one case) – for an explanation of this phenomenon, see Interesting case of watching log file growth during a perf test.
His queries tell me that with the 10-record per batch and 128-connections:
- Average write-stall to the data file is 37ms
- Average write-stall to the log file is 18ms
- Top wait types are PAGELATCH_EX (55% of all waits), PAGELATCH_SH (28% of all waits), and WRITELOG (14% of all waits)
The first two waits are an insert hotspot in the table, and the third is the log manager waiting for log block flushes to disk to complete.
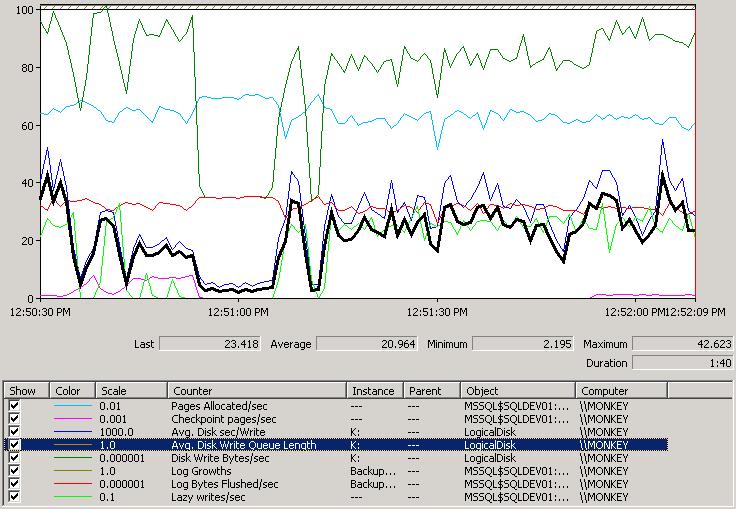
Let’s look at a a perfmon capture during the 10-records per batch test with 128 connections:

Let’s go through each counter (top to bottom in the list in the image) and explain what’s going on. I deliberately picked this time-slice, as it really simply shows the effect of contention:
- Pages Allocated/sec: this is the light blue line and is the Access Methods part of the Storage Engine (the dev team I used to run) creating new data and index pages for the clustered index we’re populating.
- Checkpoint pages/sec: this is the pink line at the bottom left and bottom right of the capture. This is the buffer pool writing out dirty pages during a periodic checkpoint.
- Avg. Disk sec/Write: this is the dark blue line that’s tracking just above the thick black line. It’s the amount of time in ms for a write to complete. You can see that it has a minimum around 12:51:00 and then varies wildly, hitting as high as 50+ms for a single write.
- Avg. Disk Write Queue Length: this is the highlighted line in thick black. It also has a minimum around 12:51:00 and varies wildly the rest of the time.
- Disk Write Bytes/sec: this is the dark green line at the top that shows the number of bytes being written to disk from all IO sources. Same story around 12:51:00.
- Log Growths: A simple counter since the database was created/server started. It’s over 100 and off the chart.
- Log Bytes Flushed/sec: this is the red, fairly constant line around 1/3 the way up and is log blocks being flushed to disk because of transaction commits or checkpoints.
- Lazy writes/sec: this is the light green line at the bottom and is the buffer pool having to force data pages to be written to disk (along with all transaction log flushed up to the point of the last log record to change the page being written) to make space for images of newly created pages.
This time-slice is really cool in that it shows what happens when contention goes away. Just before 12:51:00, a checkpoint ends and the lazy writer has nothing to do – so the only I/Os hitting the disks are those coming from the transaction log flushing out log blocks as transactions commit. You can see the Avg. Disk Write Queue Length drop down to 2-3, the Avg. Disk sec/Write drop to about 5ms, and most beautiful of all (look, I’m a big geek ok? :-), the Disk Write Bytes/sec (the green line) drops down to be exactly equal to the Log Bytes Flushed/sec – proving that it’s just log flushes hitting the disk. This is the no-contention case. It happens again for brief spell about 10 seconds later – the lazy writer most likely created a temporary surfeit of empty buffers. All the rest of the time, the lazy writer and checkpoints play havoc with the write throughput on the drives by causing contention.
It’s clearly time to try some separation of files to relieve the contention – and that’s what I’ll cover in the next post in the series.
Hope you’re enjoying the series – these take a long time to write up!

23 thoughts on “Benchmarking: 1-TB table population (part 2: optimizing log block IO size and how log IO works)”
Hello,
Great multi post stuff ! :)
That won’t change things as you have your reference performances, but i am curious if you enabled jumbo frames ? This will raise mtu from 1500 to 9000.
That will decrease the number of packet/second. If packets are fully loaded, it divide per 6 the packet/seconds.
MD3000 are not very powerful from my experience, but i get better throughput with my single Velociraptor (locally on the computer)
The MD3000i support jumbo frame as stated here:
http://support.dell.com/support/edocs/systems/md3000i/en/SUPPORTMATRIX/Sup_Matx.pdf
The PowerConnect switch support it to. To activate:
http://www.delltechcenter.com/page/Configuring+a+PowerConnect+5424+or+5448+Switch+for+use+with+an+iSCSI+storage+system
Have also to activate it on the server network card
Sorry if annoying, but as many sysadmin, i can’t prevent myself from trying to increase your numbers !
Passionating subjects !
This is a great series Paul, I just went back and reviewed the prior article and hardware setup. Already has me thinking about modifications to some of my big-but-not-bulk data loads that could be consuming less of a time window. Enjoyable to see your interaction with other MVPs while doing this, what a community!
BTW, unless I’m missing something, I’m assuming tempdb is on the same 8-drive RAID-10 array as the data and log files, right? Not a big deal in the testing so far but I’m just thinking about the series as it progresses into more complex testing. Thanks!
@Noel Thanks! Nope, tempdb is in the standard location on C: right now as I’m not doing anything that uses it. It’ll become very important when I start doing large sorts that spill out of memory, temp tables, versioning and so on.
Thanks for writing this series. I am learning alot about perf.
Thanks Paul, this is very interesting :)
@Mathieu Nope – didn’t explicitly enable jumbo frames (that’s something Denny Cherry mentioned too). I’m going to wait until I can saturate the network from the SQL Server side and then play around with the network settings. Thanks!
Paul,
Great series. Thanks.
When I was asking about iSCSI config last time, here was my rationale.
You have 2x1Gbe NICs configured for iSCSI, so best case scenario iSCSI throughtput should be 200MB/sec. You seeing around 100MB/sec (?or maybe you’re using only one NIC for iSCSI?), so there’s room for improvement (separation of the iSCSI and client ip traffic, maybe use non-tcpip sql connection, use jumbo packets, etc.) Here’s a good source from our friends at MSFT: http://msdn.microsoft.com/en-us/library/bb649502(SQL.90).aspx.
Next, you have 8x15K SCSI drives in RAID-10, each 15K drive should give you around 100MB/sec for the write performance (http://www.tomshardware.com/charts/enterprise-hard-drive-charts/File-Writing-Performance,705.html).
So again best case scenario you should get 400MB/sec (0.5 factor for the mirror in RAID-10) throughtput for the SAN end of the config.
So to make IO system balanced across controller/disks path you need at least 4x1Gb dedicated NICs (with MPIO configured for round-robin and other best practices) to serve 8x15K SCSI HDDs configured in RAID-10.
BTW, because it seems you nave iSCSI controller bottleneck, splitting files may not give any performance improvements.
Instead of batching singleton inserts in an explicit transaction, I am interested in seeing similar numbers with multi-row inserts. You could build a string that inserts multiple rows using row constructors or UNION ALL.
This will insert 10 rows at once:
INSERT MyBigTable (c2)
VALUES(‘a’),(‘a’),(‘a’),(‘a’),(‘a’),(‘a’),(‘a’),(‘a’),(‘a’),(‘a’)
To make it simple just reduce the number of time you call it.
I ran a few tests on my laptop inserting 100,000 rows with a single connection.
Using your method of singleton inserts, ten per transaction, it took 40 seconds.
Using row constructors with 1,000 row blocks, it took 18 seconds.
I ran the tests many times with very consistent results.
@Rob Ok – now you’re being all T-SQL programmy on me. If it ain’t low-level C++, I’m not an expert. Care to send me some T-SQL to do what you’re describing and I’ll run it?
I don’t see how that would produce any different results than a transaction with 10 insert statements – still the same log records, page accesses and query plan.
Cool – I’ll give it a whirl and figure out what it’s doing differently.
Rob – I tried using a 100 row constructor and the timing results were exactly the same – over a 128-million row test. This test is governed by how quickly the pages can be created and written out to disk, with the log. Maybe with smaller row-sizes it would make a difference – something to experiment with.
Nope – not using both of them and that’s on the list of things to try.
Keep ’em coming Paul. Interesting.
I was expecting more of a difference when batching modifications in same transaction, but perhaps because SQL server can batch several commits in same I/O reduces this effect a bit? I have a feeling that the functionality in SQL Server was added "recently" (vaguelly speaking – includes 6-5 -> 7.0) and the difference used to be even more significant.
Hey Tibor – yeah, Kimberly was telling me about some transaction log pef hacks that were in 6.5 that could sped things up a lot – but at the very dodgy expense of committing transactions without flushing the log records to disk first. That code isn’t there any more :-) The limiting factor on the speed-up from batching is the log writes – as soon as a transaction is filling up to 60KB of log, there no gain (in my current setup) from going higher. Maybe that will change once I tune the system more – I’ll be going back to try tweaking some of the earlier improvements again once I’m not IO bound. Cheers
Another test to try is to disable automatic checkpoints with TF 3505 and try manual checkpoints on preset intervals from a dedicated connection.
Yup – manual checkpoints are on my list.
Very cool stuff, Paul – I’m a little late, but I’m all caught up now. I’m interested in quantifying the effects of splitting the log and data
Great stuff Paul. Really looking forward to the next posting.
THX Paul!
One more question, have you enabled instant file initialization?
@torsten Yes – at installation time.