Continuing my series on advanced performance troubleshooting – see these two posts for the scripts I’ll be using and an introduction to the series:
- Wait statistics, or please tell me where it hurts
- Advanced performance troubleshooting: waits, latches, spinlocks
In this blog post I’d like to show you an example of SOS_SCHEDULER_YIELD waits occurring and how it can seem like a spinlock is the cause.
(Note: you can read more about SOS_SCHEDULER_YIELD waits in my sqlperformance.com blog post here.)
Check It Out!
I originally published this blog post and then had a discussion with good friend Bob Ward from Product Support who questioned my conclusions given what he’s seen (thanks Bob!). After digging in further, I found that my original post was incorrect, so this is the corrected version.
The SOS_SCHEDULER_YIELD wait means that an executing thread voluntarily gave up the CPU to allow other threads to execute. The SQL Server code is sprinkled with “voluntary yields” in places where high CPU usage may occur.
One such place where a thread will sleep but not explicitly yield is when backing off after a spinlock collision waiting to see if it can get access to the spinlock. A spinlock is a very lightweight synchronization mechanism deep inside SQL Server that protects access to a data structure (not database data itself). See the end of the second blog post above for more of an explanation on spinlocks.
When a thread voluntarily yields, it does not go onto the waiting tasks list – as it’s not waiting for anything – but instead goes to the bottom of the Runnable Queue for that scheduler. SOS_SCHEDULER_YIELD waits by themselves are not cause for concern unless they are the majority of waits on the system, and performance is suffering.
To set up the test, I’ll create a simple database and table:
USE [master];
GO
DROP DATABASE [YieldTest];
GO

CREATE DATABASE [YieldTest];
GO
USE [YieldTest];
GO

CREATE TABLE [SampleTable] ([c1] INT IDENTITY);
GO
CREATE NONCLUSTERED INDEX [SampleTable_NC] ON [SampleTable] ([c1]);
GO

SET NOCOUNT ON;
GO
INSERT INTO [SampleTable] DEFAULT VALUES;
GO 100
Then I’ll clear out wait stats and latch stats:
DBCC SQLPERF (N'sys.dm_os_latch_stats', CLEAR);
GO

DBCC SQLPERF (N'sys.dm_os_wait_stats', CLEAR);
GO
And then fire up 50 clients running the following code (I just have a CMD script that fires up 50 CMD windows, each running the T-SQL code):
USE [YieldTest];
GO
SET NOCOUNT ON;
GO

DECLARE @a INT;
WHILE (1=1)
BEGIN
    SELECT @a = COUNT (*) FROM [YieldTest]..[SampleTable] WHERE [c1] = 1;
END;
GO
And the CPUs in my laptop are jammed solid (snapped from my desktop and rotated 90 degrees to save space):
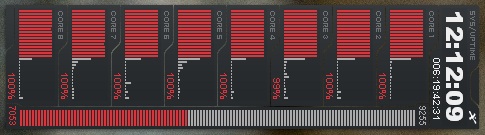
Wow!
Looking at perfmon:
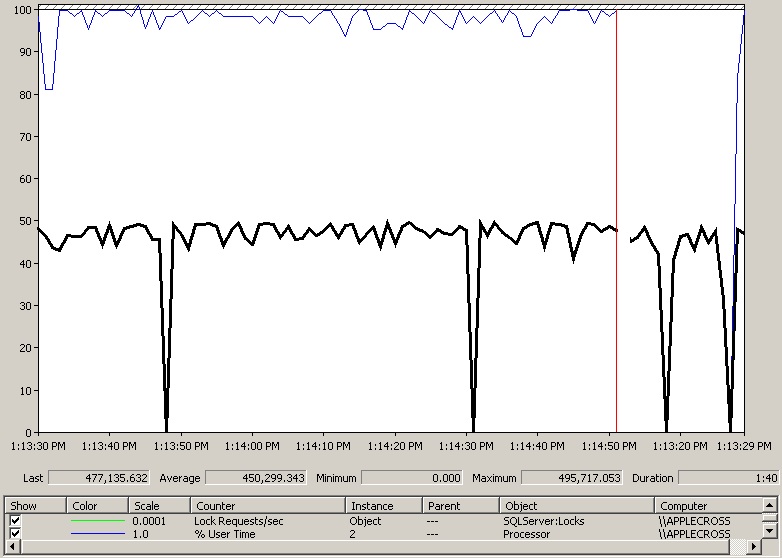
The CPU usage is not Windows (% User Time), and of all the counters I usually monitor (I’ve cut them all out here for clarity) I can see a sustained very high Lock Requests/sec for Object and Page locks (almost 950 thousand requests per second for both types! Gotta love my laptop :-)
So let’s dig in. First off, looking at wait stats (using the script in the wait stats post referenced above):
WaitType            Wait_S  Resource_S Signal_S WaitCount Percentage AvgWait_S AvgRes_S AvgSig_S
------------------- ------- ---------- -------- --------- ---------- --------- -------- --------
SOS_SCHEDULER_YIELD 4574.77 0.20       4574.57  206473    99.43      0.0222    0.0000   0.0222
SOS_SCHEDULER_YIELD at almost 100% of the waits on the system means that I’ve got CPU pressure – as I saw from the CPU graphs above. The fact that nothing else is showing up makes me suspect this is a spinlock issue.
Checking in the sys.dm_os_waiting_tasks output (see script in the second blog post referenced above), I see nothing waiting, and if I refresh a few times I see the occasional ASYNC_NETWORK_IO and/or PREEMPTIVE_OS_WAITFORSINGLEOBJECT wait type – which I’d expect from the CMD windows running the T-SQL code.
Checking the latch stats (again, see script in the second blog post referenced above) shows no latch waits apart from a few BUFFER latch waits.
So now let’s look at spinlocks. First off I’m going to take a snapshot of the spinlocks on the system:
-- Baseline
IF EXISTS (SELECT * FROM [tempdb].[sys].[objects]
    WHERE [name] = N'##TempSpinlockStats1')
    DROP TABLE [##TempSpinlockStats1];
GO
SELECT * INTO [##TempSpinlockStats1]
FROM sys.dm_os_spinlock_stats
WHERE [collisions] > 0
ORDER BY [name];
GO
(On 2005 you’ll need to use DBCC SQLPERF (‘spinlockstats’) and use INSERT/EXEC to get the results into a table – see the post above for example code.)
Then wait 10 seconds or so for the workload to continue… and then grab another snapshot of the spinlocks:
-- Capture updated stats
IF EXISTS (SELECT * FROM [tempdb].[sys].[objects]
    WHERE [name] = N'##TempSpinlockStats2')
    DROP TABLE [##TempSpinlockStats2];
GO
SELECT * INTO [##TempSpinlockStats2]
FROM sys.dm_os_spinlock_stats
WHERE [collisions] > 0
ORDER BY [name];
GO
Now running the code I came up with to show the difference between the two snapshots:
-- Diff them
SELECT
    '***' AS [New],
    [ts2].[name] AS [Spinlock],
    [ts2].[collisions] AS [DiffCollisions],
    [ts2].[spins] AS [DiffSpins],
    [ts2].[spins_per_collision] AS [SpinsPerCollision],
    [ts2].[sleep_time] AS [DiffSleepTime],
    [ts2].[backoffs] AS [DiffBackoffs]
FROM [##TempSpinlockStats2] [ts2]
LEFT OUTER JOIN [##TempSpinlockStats1] [ts1]
    ON [ts2].[name] = [ts1].[name]
WHERE [ts1].[name] IS NULL
UNION
SELECT
    '' AS [New],
    [ts2].[name] AS [Spinlock],
    [ts2].[collisions] - [ts1].[collisions] AS [DiffCollisions],
    [ts2].[spins] - [ts1].[spins] AS [DiffSpins],
    CASE ([ts2].[spins] - [ts1].[spins]) WHEN 0 THEN 0
        ELSE ([ts2].[spins] - [ts1].[spins]) /
            ([ts2].[collisions] - [ts1].[collisions]) END
            AS [SpinsPerCollision],
    [ts2].[sleep_time] - [ts1].[sleep_time] AS [DiffSleepTime],
    [ts2].[backoffs] - [ts1].[backoffs] AS [DiffBackoffs]
FROM [##TempSpinlockStats2] [ts2]
LEFT OUTER JOIN [##TempSpinlockStats1] [ts1]
    ON [ts2].[name] = [ts1].[name]
WHERE [ts1].[name] IS NOT NULL
    AND [ts2].[collisions] - [ts1].[collisions] > 0
ORDER BY [New] DESC, [Spinlock] ASC;
GO
New  Spinlock                        DiffCollisions DiffSpins  SpinsPerCollision DiffSleepTime DiffBackoffs
---- ------------------------------- -------------- ---------- ----------------- ------------- ------------
     LOCK_HASH                       6191134        4005774890 647               686           1601383
     OPT_IDX_STATS                   1164849        126549245  108               57            7555
     SOS_OBJECT_STORE                73             305        4                 0             0
     SOS_WAITABLE_ADDRESS_HASHBUCKET 115            44495      386               0             3
     XDESMGR                         1              0          0                 0             0
This is telling me that there is massive contention for the LOCK_HASH spinlock, further backed up by the OPT_IDX_STATS spinlock (which controls access to the metrics tracked by sys.dm_db_index_usage_stats). The LOCK_HASH spinlock protects access to the hash buckets used by the lock manager to efficiently keep track of the lock resources for locks held inside SQL Server and to allow efficient searching for lock hash collisions (i.e. does someone hold the lock we want in an incompatible mode?). In this case the contention is so bad that instead of just spinning, the threads are actually backing off and letting other threads execute to allow progress to be made.
And that makes perfect sense because of what my workload is doing – 50 concurrent connections all trying to read the same row on the same page in the same nonclustered index.
But is that the cause of the SOS_SCHEDULER_YIELD waits? To prove it one way or the other, I created an Extended Event session that would capture call stacks when a wait occurs:
-- Note that before SQL 2012, the wait_type to use is 120, and
-- on 2014 SP1 the wait_type to use is 123. You MUST verify the
-- map_value to use on your build.
-- On SQL 2012 the target name is 'histogram' but the old name still works.
CREATE EVENT SESSION [MonitorWaits] ON SERVER
ADD EVENT [sqlos].[wait_info]
	(ACTION ([package0].[callstack])
	WHERE [wait_type] = 124) -- SOS_SCHEDULER_YIELD only
ADD TARGET [package0].[asynchronous_bucketizer] (
    SET filtering_event_name = N'sqlos.wait_info',
    source_type = 1, -- source_type = 1 is an action
    source = N'package0.callstack') -- bucketize on the callstack
WITH (MAX_MEMORY = 50MB, max_dispatch_latency = 5 seconds)
GO

-- Start the session
ALTER EVENT SESSION [MonitorWaits] ON SERVER STATE = START;
GO

-- TF to allow call stack resolution
DBCC TRACEON (3656, -1);
--DBCC TRACEON (2592, -1); -- SQL Server 2019+ requires this too
GO

-- Let the workload run for a few seconds

-- Get the callstacks from the bucketizer target
-- Are they showing calls into the lock manager?
SELECT
    [event_session_address],
    [target_name],
    [execution_count],
    CAST ([target_data] AS XML)
FROM sys.dm_xe_session_targets [xst]
INNER JOIN sys.dm_xe_sessions [xs]
    ON ([xst].[event_session_address] = [xs].[address])
WHERE [xs].[name] = N'MonitorWaits';
GO

-- Stop the event session
ALTER EVENT SESSION [MonitorWaits] ON SERVER STATE = STOP;
GO
I also made sure to have the correct symbol files in the \binn directory (see How to download a sqlservr.pdb symbol file). After running the workload and examining the callstacks, I found the majority of the waits were coming from voluntary yields deep in the Access Methods code. An example call stack is:
IndexPageManager::GetPageWithKey+ef [ @ 0+0x0
GetRowForKeyValue+146 [ @ 0+0x0
IndexRowScanner::EstablishInitialKeyOrderPosition+10a [ @ 0+0x0
IndexDataSetSession::GetNextRowValuesInternal+7d7 [ @ 0+0x0
RowsetNewSS::FetchNextRow+12a [ @ 0+0x0
CQScanRangeNew::GetRow+6a1 [ @ 0+0x0
CQScanCountStarNew::GetRowHelper+44 [ @ 0+0x0
CQScanStreamAggregateNew::Open+70 [ @ 0+0x0
CQueryScan::Uncache+32f [ @ 0+0x0
CXStmtQuery::SetupQueryScanAndExpression+2a2 [ @ 0+0x0
CXStmtQuery::ErsqExecuteQuery+2f8 [ @ 0+0x0
CMsqlExecContext::ExecuteStmts<1,1>+cca [ @ 0+0x0
CMsqlExecContext::FExecute+58b [ @ 0+0x0
CSQLSource::Execute+319
[Edit: check out how to do this in the spinlock whitepaper]
This is clearly (to me) nothing to do with the LOCK_HASH spinlock, so that’s a red herring. In this case, I’m just CPU bound. When a thread goes to sleep when backing off from a spinlock, it directly calls Windows Sleep() – so it does not show up as a SQL Server wait type at all, even though the sleep call is made from the SQL OS layer. Which is a bummer.
How to get around that and reduce CPU usage? This is really contrived workload, but this can occur for real. Even if I try using WITH (NOLOCK), the NOLOCK seek will take a table SCH_S (schema-stability) lock to make sure the table structure doesn’t change while the seek is occurring, so that only gets rid of the page locks, not the object locks and doesn’t help CPU usage. With this (arguably weird) workload, there are a few things I could do (just off the top of my head):
- Enable read_commited_snapshot for the database, which will reduce the LOCK_HASH spinlock backoffs
- Scale-out the connections to a few copies of the database, updated using replication
- Do some mid-tier or client-side caching, with some notification mechanism of data changes (e.g. a DDL trigger firing a Service Broker message)
So this was an example of where wait stats lead to having to look at spinlock stats, but that the spinlock, on even *deeper* investigation, wasn’t the issue at all. Cool stuff.
Next time we’ll look at another cause of SOS_SCHEDULER_YIELD waits.
Hope you enjoyed this – let me know your thoughts!
Cheers
PS In the latest SQLskills Insider Quick Tips newsletter from last week, I did a video demo of looking at transaction log IOs and waits – you can get it here.
26 thoughts on “SOS_SCHEDULER_YIELD waits and the LOCK_HASH spinlock”
Very good post Paul. Thanks much.
Regards
Meher
Hi Paul,
thanks for this. There’s so much in depth stuff in this post, it is very interesting to get deep into the internals. I’d like to see more like this.
Thanks again
Paul.
Hi Paul,
Thanks again for the awesome info…. you really do give a good insight into SQL internals.
Look forward to many more posts.
Steve
Paul, any way to do this in 2005? This is very relevant to some issues we’ve had over the past week.
Thanks,
Eric Humphrey
Did my exercise (Thanks for the help):
— Baseline
IF OBJECT_ID(‘tempdb..#TempSpinlockStats1’) IS NOT NULL
DROP TABLE #TempSpinlockStats1;
GO
CREATE TABLE #TempSpinlockStats1(
[name] NVARCHAR(30) NOT NULL,
[collisions] BIGINT NOT NULL,
[spins] BIGINT NOT NULL,
[spins_per_collision] FLOAT NOT NULL,
[sleep_time] BIGINT NOT NULL,
[backoffs] BIGINT NOT NULL
)
INSERT INTO #TempSpinlockStats1
EXEC (‘DBCC SQLPERF(”spinlockstats”)’)
GO
Hey Eric – everything here should work on 2005 except XEvents.
And you’ll need to use DBCC SQLPERF(spinlockstats) instead and change the snapshot code to use INSERT/EXEC into two tables with the right column names/types
Excellent – I updated both posts with credit to you – thanks Eric!
Hi Paul,I have never heard about spinlocks till you blogged about it, thanks for sharing the knowledge.
Thanks
Thanks Paul Randals :)
Hi Paul,
Very interesting. There is one thing I don’t understand and that may want to explain. 50 ongoing processes on 8 schedulers, isn’t that exactly why processes should yield? Because otherwise only 8 of the 50 could do any work? So the I don’t understand your: “The fact that nothing else is showing up makes me suspect this is a spinlock issue.” In my understanding there would be scheduler_yield waits also without spinlock contention.
Thanks for your reply!
Paul
Yes indeed – which is the point of the article – demonstrating that spinlock contention is very rarely the root cause of SOS_SCHEDULER_YIELDs.
Hi Paul,
For the past 16 hours I have had 1 query running on my SQL 2012 Ent instance which is simply doing a SELECT INTO of 45000 rows into a static table – when I captured the waits for the session via the Extended Events I got back the following:
Wait Type Wait Count Total Wait Time (ms) Total Resource Wait Time (ms) Total Signal Wait Time (ms)
SOS_SCHEDULER_YIELD 22674 77 42 35
PAGEIOLATCH_EX 85 29 29 0
PAGEIOLATCH_SH 12 4 4 0
I did the spinlock test above and got the following: (10 second gap)
New Spinlock DiffCollisions DiffSpins SpinsPerCollision DiffSleepTime DiffBackoffs
HADR_AR_CONTROLLER_COLLECTION 1 250 250 0 0
LOCK_HASH 4627 1688250 364 0 583
LOGCACHE_ACCESS 18 6146 341 0 16
LSLIST 1 416 416 0 0
SOS_BLOCKALLOCPARTIALLIST 352 916844 2604 0 89
SOS_OBJECT_STORE 7 3718 531 0 2
SOS_RW 3 750 250 0 0
SOS_SCHEDULER 130 39882 306 0 3
SOS_SUSPEND_QUEUE 3 750 250 0 0
SOS_TASK 2 526 263 0 0
SVC_BROKER_CTRL 11 17534 1594 0 0
SVC_BROKER_LIST 2 1012 506 0 0
X_PACKET_LIST 232 65000 280 0 6
XDESMGR 8 2000 250 0 0
XID_ARRAY 5 2737 547 0 1
The query is below:
SELECT
ds1.*,
ds2.*
FROM [XXXXXXX].[XXXXXX].[XXXXXXX] ds2 WITH (NOLOCK)
INNER JOIN [XXXXXX].[XXXXXX].[XXXXXXXXX] ds1 WITH (NOLOCK)
ON ds2.EventID = ds1.OBEventID
AND ds2.EventSelectionID = ds1.OBEventSelectionID
AND ds2.AdjustedCreateDate = ds1.ScrapingDate
AND ds2.AdjustedCreateHour = ds1.Scrapinghour
AND ds2.AdjustedCreateMinute = ds1.ScrapingMinute
OPTION (MAXDOP 1)
if I request the user kills the query and re run it sometimes it will just go through in 20 minutes.
It is not waiting on anything when I check sys.dm_os_waiting_tasks and is in a RUNNABLE state when I check sp_whoisactive
Really stumped on what to check next based on the above – I did hit this issue before but it was related to temp tables.
Would be great to get a pointer.
Thanks.
The spinlocks look fine to me, but the wait statistics don’t look remotely realistic at all for 16 hours of running. Even if the single thread has been constantly busy with no waits, it would still be registering 16 hours worth of SOS_SCHEDULER_YIELD (which would be 16 x 3600 x 1000ms / 4ms = 14400000 yields). I suspect something wrong with how you’re monitoring the waits. I’d look closely at that, then also sample dm_os_waiting_tasks once a second for just that spid for, say, 10-15 mins and persist the results into a table. Then analyze and see if you if anything pops up. Very difficult to diagnose from the data you’ve posted.
Jack – were you able to come to a conclusion on this? I’m having a similar issue with my 2008R2 and 2014 instances and a couple Insert Into statements will sit for 8+ hours and show SOS_SCHEDULER_YIELD with no other queries running on a system that has 4 physical CPU’s (32 total cores) and very low cpu usage.
Paul, per what you wrote (“When a thread goes to sleep when backing off from a spinlock, it directly calls Windows Sleep() – so it does not show up as a SQL Server wait type at all“) wouldn’t that mean that the SOS_SCHEDULER_YIELD wait would not even register if it were a SPINLOCK problem to begin with? So the fact that you DID see that waittype indicates that it is not right away (?)
Thanks.
Correct – SOS_SCHEDULER_YIELD is not a direct sign of spinlock contention, but in cases I’ve seen, the fact that it’s an in memory workload (and so showing SOS_SCHEDULER_YIELD) makes it more prevalent to spinlock contention being an issue (more threads contending for non-latch/wait resources). Make sense?
Is loading the symbols and capturing the callstack something that is safe for a production system? Your example here is an example situation.
I am seeing a lot of SERVICE_BROKER_TRANSMISSION_WORKTABLE (0000000003A2AD10) with a wait_type of LATCH_SH.
Yes, it’s safe to do in production.
Hi Paul,
thanks for the post. We are facing heavy spinlock contention (SQL 2104 Ent). Here is our callstack (spinlock SOS_OBJECT_STORE, backoff occurrence about 30.000 per minute):
sqldk.dll!XeSosPkg::spinlock_backoff::Publish+0x138
sqldk.dll!SpinlockBase::Sleep+0xc5
sqlmin.dll!Spinlock<250,1,1>::SpinToAcquireWithExponentialBackoff+0x169
sqlmin.dll!LockManager::GetLockBlocks+0x76
sqlmin.dll!lck_lockInternal+0x310
sqlmin.dll!GetLock+0x1ea
sqlmin.dll!BTreeRow::AcquireLock+0x210
sqlmin.dll!IndexRowScanner::AcquireNextRowLock+0xb1
sqlmin.dll!IndexDataSetSession::GetNextRowValuesInternal+0x1265
sqlmin.dll!RowsetNewSS::FetchNextRow+0x197
sqlmin.dll!CQScanRowsetNew::GetRowWithPrefetch+0x51
sqlmin.dll!CQScanRangeNew::GetRow+0x15b
sqlmin.dll!CQScanNLJoinTrivialNew::GetRow+0x196
sqlmin.dll!CQScanBatchSortNew::BuildSortTable+0x166
sqlmin.dll!CQScanBatchSortNew::GetRowHelper+0x4d7
sqlmin.dll!CQScanRangePrefetchDelayNew::GetRow+0xd6
sqlmin.dll!CQScanNLJoinTrivialNew::GetRow+0xe5
sqlmin.dll!CQScanProjectNew::GetRow+0x25
sqlmin.dll!CQueryScan::GetRow+0x81
sqllang.dll!CXStmtQuery::ErsqExecuteQuery+0x54a
sqllang.dll!CXStmtSelect::XretExecute+0x2e7
sqllang.dll!CMsqlExecContext::ExecuteStmts<1,0>+0x1782
sqllang.dll!CMsqlExecContext::FExecute+0xa3a
sqllang.dll!CSQLSource::Execute+0x86c
It seems the problem is connected to acquiring a lock. Is it possible to get more info from the callstack, for example the type of lock (shared?) or its granularity (Key?)? I think, the lock manager keeps some internal structures per index and partition, where the spinlock comes from. Is that true? We have already revised transaction isolation level. The database is not partitioned at all.
And the most important, what can we do to get it better? Can partitioning solve our problem? Any other ideas?
Thank you very much for answer in advance.
THE SOS_OBJECT_STORE spinlock is used all over the place but you’ve done the right thing by capturing the callstack. As this is locking, about the only thing you can do is reduce the number of locks being acquired. If it’ll work for your application, try turning off page locks for the table/index being scanned (note that you won’t be able to use ALTER INDEX … REORGANIZE on it after doing so, as it requires page locks).
Bonjour Paul,
Greates Articel
“This is telling me that there is massive contention for the LOCK_HASH spinlock, further backed up by the SOS_WAITABLE_ADDRESS_HASHBUCKET spinlock”
Please tell us SOS_WAITABLE_ADDRESS_HASHBUCKET also
Google search finds http://sqlonice.com/unsung-sqlos-sos_waitableaddress/ – thanks
Hi Paul,
Here are our server call stacks (from two different workers) analyzed with WinDbg from my workstation. We had Non-yielding Scheduler dump issue. In the time when this was happening there were many connection timeouts at production server (Errors 18456 state 38 and 17830 state 105 and OS error 10054) and later started to occur fatal errors 9001 and 21.
0:072> ~~[0x3660]s
sqlmin!Spinlock::SpinToAcquireWithExponentialBackoff+0x120:
00007ffb`3972c514 f390 pause
0:072> kL100
# Child-SP RetAddr Call Site
00 00000011`3d3f73a0 00007ffb`398bcf14 sqlmin!Spinlock::SpinToAcquireWithExponentialBackoff+0x120
01 00000011`3d3f7400 00007ffb`396c395c sqlmin!DirtyPageMgr::WrotePage+0x5d
02 00000011`3d3f7430 00007ffb`396c367c sqlmin!RecoveryUnit::WrotePage+0x1c
03 00000011`3d3f7490 00007ffb`39621316 sqlmin!BPool::WritePageCompletion+0x147
04 00000011`3d3f79f0 00007ffb`42829ea6 sqlmin!FCB::IoCompletion+0x97
05 00000011`3d3f7a70 00007ffb`42811693 sqldk!IOQueue::CheckForIOCompletion+0x426
06 00000011`3d3f7ca0 00007ffb`42811d2c sqldk!SOS_Scheduler::SwitchContext+0x173
07 00000011`3d3f7f70 00007ffb`395d185f sqldk!SOS_Scheduler::SuspendNonPreemptive+0xd3
08 00000011`3d3f7fb0 00007ffb`3960ac4e sqlmin!EventInternal::Wait+0x1e7
09 00000011`3d3f8000 00007ffb`395d714e sqlmin!LatchBase::Suspend+0x697
0a 00000011`3d3f8d80 00007ffb`395d799c sqlmin!BUF::AcquireLatch+0x7e
0b 00000011`3d3f8dd0 00007ffb`396d8fe5 sqlmin!BPool::Get+0x117
0c 00000011`3d3f8e40 00007ffb`397b26c6 sqlmin!IAMPageRef::Fix+0xfc
0d 00000011`3d3f8ea0 00007ffb`397b1ea5 sqlmin!DeAllocMgr::DropAllocUnitInternal+0x3b1
0e 00000011`3d3f91c0 00007ffb`39828456 sqlmin!DropAllocationUnit+0x18b
0f 00000011`3d3f9280 00007ffb`3971769d sqlmin!DeAllocateIndexNew+0x629
10 00000011`3d3f94d0 00007ffb`3961f3b6 sqlmin!SETruncateWorktableRowset+0x9d3
11 00000011`3d3f9be0 00007ffb`3978e67c sqlmin!SETruncateRowset+0x15b
12 00000011`3d3fda30 00007ffb`3978c6a8 sqlmin!RowsetWorkTableSS::Truncate+0x7c
13 00000011`3d3fdae0 00007ffb`39789b12 sqlmin!SqlProfTruncateWorktableRowset+0x4e
14 00000011`3d3fdb20 00007ffb`3981399c sqlmin!CQScanSpoolNew::ChangeSpoolState+0x168
15 00000011`3d3fdb50 00007ffb`395fd9a7 sqlmin!CQScanSpoolNew::PrepRecompute+0x15e
16 00000011`3d3fdb90 00007ffb`395fcd9e sqlmin!CQScanNew::PrepRecomputeHelper+0x87
17 00000011`3d3fdbc0 00007ffb`3963c961 sqlmin!CQScanNLJoinNew::OpenInner+0x1e4
18 00000011`3d3fdc00 00007ffb`396120f6 sqlmin!CQScanNLJoinNew::GetRowHelper+0xed
19 00000011`3d3fdc30 00007ffb`3961218b sqlmin!CQScanSortNew::BuildSortTable+0x266
1a 00000011`3d3fdcb0 00007ffb`395fad61 sqlmin!CQScanSortNew::OpenHelper+0xbc
1b 00000011`3d3fdce0 00007ffb`395fafad sqlmin!CQScanNew::OpenHelper+0x41
1c 00000011`3d3fdd10 00007ffb`395fad61 sqlmin!CQScanStreamAggregateNew::Open+0x39
1d 00000011`3d3fdd40 00007ffb`396fb530 sqlmin!CQScanNew::OpenHelper+0x41
1e 00000011`3d3fdd70 00007ffb`19dd08f8 sqlmin!CQueryScan::UncacheQuery+0x40b
1f 00000011`3d3fdde0 00007ffb`19dd09c4 sqllang!CXStmtQuery::SetupQueryScanAndExpression+0x421
20 00000011`3d3fde60 00007ffb`19dd4507 sqllang!CXStmtQuery::InitForExecute+0x34
21 00000011`3d3fde90 00007ffb`19dd46c5 sqllang!CXStmtQuery::ErsqExecuteQuery+0x4dc
22 00000011`3d3fe010 00007ffb`19dd209a sqllang!CXStmtSelect::XretExecute+0x322
23 00000011`3d3fe0e0 00007ffb`19dd29d3 sqllang!CMsqlExecContext::ExecuteStmts+0x40d
24 00000011`3d3fe220 00007ffb`19dd1ab1 sqllang!CMsqlExecContext::FExecute+0xa9e
25 00000011`3d3fe550 00007ffb`19ddb18b sqllang!CSQLSource::Execute+0x983
26 00000011`3d3fe6f0 00007ffb`19ddfc02 sqllang!process_request+0xe61
27 00000011`3d3fecc0 00007ffb`19ddf763 sqllang!process_commands_internal+0x2df
28 00000011`3d3fed40 00007ffb`428159fd sqllang!process_messages+0x253
29 00000011`3d3fef50 00007ffb`428154d5 sqldk!SOS_Task::Param::Execute+0x231
2a 00000011`3d3ff550 00007ffb`4281512d sqldk!SOS_Scheduler::RunTask+0xaa
2b 00000011`3d3ff5c0 00007ffb`42835a28 sqldk!SOS_Scheduler::ProcessTasks+0x3cd
2c 00000011`3d3ff6a0 00007ffb`42835e00 sqldk!SchedulerManager::WorkerEntryPoint+0x2a1
2d 00000011`3d3ff770 00007ffb`42835907 sqldk!SystemThread::RunWorker+0x8f
2e 00000011`3d3ff7a0 00007ffb`42835c58 sqldk!SystemThreadDispatcher::ProcessWorker+0x2de
2f 00000011`3d3ff850 00007ffb`63008364 sqldk!SchedulerManager::ThreadEntryPoint+0x1d8
30 00000011`3d3ff900 00007ffb`650170d1 kernel32!BaseThreadInitThunk+0x14
31 00000011`3d3ff930 00000000`00000000 ntdll!RtlUserThreadStart+0x21
0:072> ~~[0x2a28]s
ntdll!NtSignalAndWaitForSingleObject+0x14:
00007ffb`65059524 c3 ret
0:082> kL100
# Child-SP RetAddr Call Site
00 00000012`05dff6e8 00007ffb`623bcd90 ntdll!NtSignalAndWaitForSingleObject+0x14
01 00000012`05dff6f0 00007ffb`42814b99 KERNELBASE!GetImmersiveColorTypeFromName+0x1f0f0
02 00000012`05dff7a0 00007ffb`42811d2c sqldk!SOS_Scheduler::Switch+0x106
03 00000012`05dffa90 00007ffb`428153e2 sqldk!SOS_Scheduler::SuspendNonPreemptive+0xd3
04 00000012`05dffad0 00007ffb`428150e6 sqldk!WorkDispatcher::DequeueTask+0x59c
05 00000012`05dffb70 00007ffb`42835a28 sqldk!SOS_Scheduler::ProcessTasks+0x232
06 00000012`05dffc50 00007ffb`42835e00 sqldk!SchedulerManager::WorkerEntryPoint+0x2a1
07 00000012`05dffd20 00007ffb`42835907 sqldk!SystemThread::RunWorker+0x8f
08 00000012`05dffd50 00007ffb`42835c58 sqldk!SystemThreadDispatcher::ProcessWorker+0x2de
09 00000012`05dffe00 00007ffb`63008364 sqldk!SchedulerManager::ThreadEntryPoint+0x1d8
0a 00000012`05dffeb0 00007ffb`650170d1 kernel32!BaseThreadInitThunk+0x14
0b 00000012`05dffee0 00000000`00000000 ntdll!RtlUserThreadStart+0x21
—————————————————————————————
“spins diff” is column which represents a difference between spins columns (formulas in Excel). Snapshots are taken in 16h period from top 5 spinklocks dmv sys.dm_os_spinlock_stats sorted by spins (yesterday and today)
name collisions spins spins_per_collision sleep_time backoffs spins diff
DP_LIST 456351 602602949680 1320481 339523 143807 3426492500
SOS_OBJECT_STORE 5037713 6703702674 1330.703 9691 1695019 2555235595
SOS_BLOCKDESCRIPTORBUCKET 890774 2926623029 3285.483 331 258439 515801214
LOCK_HASH 1610068 698724851 433.9723 1737 378447 246744000
X_PACKET_LIST 1661912 668952205 402.5196 7507 88989 292309250
name collisions spins spins_per_collision sleep_time backoffs
DP_LIST 524944 606029442180 1154465 339767 149476
SOS_OBJECT_STORE 6789687 9258938269 1363.677 11818 2307141
SOS_BLOCKDESCRIPTORBUCKET 1030256 3442424243 3341.329 394 305794
X_PACKET_LIST 2416001 961261455 397.873 10310 126067
LOCK_HASH 2183687 945468851 432.9691 2355 514465
—————————————————————————————
Filtered entries from SQL Server error log regarding non-yielding scheduler dump and buffer latch waits are:
2017-06-12 20:16:05.530 spid86 Time out occurred while waiting for buffer latch — type 3, bp 0000014EF28D09C0, page 4:8088, stat 0x10f, database id: 2, allocation unit id: 6488064, task 0x0000014D00A7A8C8 : 0, waittime 600 seconds, flags 0x100000003a, owning task 0x0000014ED2C488C8. Continuing to wait.
2017-06-12 20:21:05.560 spid86 Time out occurred while waiting for buffer latch — type 3, bp 0000014EF28D09C0, page 4:8088, stat 0x10f, database id: 2, allocation unit id: 6488064, task 0x0000014D00A7A8C8 : 0, waittime 900 seconds, flags 0x100000003a, owning task 0x0000014ED2C488C8. Continuing to wait.
2017-06-12 20:21:05.560 spid84 Time out occurred while waiting for buffer latch — type 3, bp 0000014F38B703C0, page 4:40440, stat 0x10f, database id: 2, allocation unit id: 6488064, task 0x0000014EE15B9088 : 0, waittime 600 seconds, flags 0x3a, owning task 0x0000014ED2C488C8. Continuing to wait.
2017-06-12 20:21:23.420 spid58 Time out occurred while waiting for buffer latch — type 3, bp 0000014F38B86B40, page 6:40440, stat 0x10f, database id: 2, allocation unit id: 6488064, task 0x0000014EE15B88C8 : 0, waittime 600 seconds, flags 0x3a, owning task 0x0000014ED2C488C8. Continuing to wait.
2017-06-12 20:26:05.590 spid84 Time out occurred while waiting for buffer latch — type 3, bp 0000014F38B703C0, page 4:40440, stat 0x10f, database id: 2, allocation unit id: 6488064, task 0x0000014EE15B9088 : 0, waittime 900 seconds, flags 0x3a, owning task 0x0000014ED2C488C8. Continuing to wait.
2017-06-12 20:26:05.590 spid86 Time out occurred while waiting for buffer latch — type 3, bp 0000014EF28D09C0, page 4:8088, stat 0x10f, database id: 2, allocation unit id: 6488064, task 0x0000014D00A7A8C8 : 0, waittime 1200 seconds, flags 0x100000003a, owning task 0x0000014ED2C488C8. Continuing to wait.
2017-06-12 20:26:23.430 spid58 Time out occurred while waiting for buffer latch — type 3, bp 0000014F38B86B40, page 6:40440, stat 0x10f, database id: 2, allocation unit id: 6488064, task 0x0000014EE15B88C8 : 0, waittime 900 seconds, flags 0x3a, owning task 0x0000014ED2C488C8. Continuing to wait.
2017-06-12 20:31:05.610 spid86 Time out occurred while waiting for buffer latch — type 3, bp 0000014EF28D09C0, page 4:8088, stat 0x10f, database id: 2, allocation unit id: 6488064, task 0x0000014D00A7A8C8 : 0, waittime 1500 seconds, flags 0x100000003a, owning task 0x0000014ED2C488C8. Continuing to wait.
2017-06-12 20:31:05.610 spid84 Time out occurred while waiting for buffer latch — type 3, bp 0000014F38B703C0, page 4:40440, stat 0x10f, database id: 2, allocation unit id: 6488064, task 0x0000014EE15B9088 : 0, waittime 1200 seconds, flags 0x3a, owning task 0x0000014ED2C488C8. Continuing to wait.
2017-06-12 20:31:23.470 spid58 Time out occurred while waiting for buffer latch — type 3, bp 0000014F38B86B40, page 6:40440, stat 0x10f, database id: 2, allocation unit id: 6488064, task 0x0000014EE15B88C8 : 0, waittime 1200 seconds, flags 0x3a, owning task 0x0000014ED2C488C8. Continuing to wait.
—————————————————————————————
Process 0:0:0 (0x3660) Worker 0x0000014ABFA7A160 appears to be non-yielding on Scheduler 5. Thread creation time: 13141733840753. Approx Thread CPU Used: kernel 0 ms, user 65046 ms. Process Utilization 24%. System Idle 75%. Interval: 70361 ms.
Process 0:0:0 (0x3660) Worker 0x0000014ABFA7A160 appears to be non-yielding on Scheduler 5. Thread creation time: 13141733840753. Approx Thread CPU Used: kernel 0 ms, user 121234 ms. Process Utilization 28%. System Idle 70%. Interval: 134978 ms.
Process 0:0:0 (0x3660) Worker 0x0000014ABFA7A160 appears to be non-yielding on Scheduler 5. Thread creation time: 13141733840753. Approx Thread CPU Used: kernel 0 ms, user 176906 ms. Process Utilization 28%. System Idle 70%. Interval: 195199 ms.
Process 0:0:0 (0x3660) Worker 0x0000014ABFA7A160 appears to be non-yielding on Scheduler 5. Thread creation time: 13141733840753. Approx Thread CPU Used: kernel 0 ms, user 232578 ms. Process Utilization 29%. System Idle 69%. Interval: 255420 ms.
Process 0:0:0 (0x3660) Worker 0x0000014ABFA7A160 appears to be non-yielding on Scheduler 5. Thread creation time: 13141733840753. Approx Thread CPU Used: kernel 0 ms, user 283687 ms. Process Utilization 29%. System Idle 69%. Interval: 315641 ms.
Process 0:0:0 (0x3660) Worker 0x0000014ABFA7A160 appears to be non-yielding on Scheduler 5. Thread creation time: 13141733840753. Approx Thread CPU Used: kernel 0 ms, user 330062 ms. Process Utilization 29%. System Idle 69%. Interval: 375861 ms.
Process 0:0:0 (0x3660) Worker 0x0000014ABFA7A160 appears to be non-yielding on Scheduler 5. Thread creation time: 13141733840753. Approx Thread CPU Used: kernel 0 ms, user 381140 ms. Process Utilization 29%. System Idle 69%. Interval: 436082 ms.
Process 0:0:0 (0x3660) Worker 0x0000014ABFA7A160 appears to be non-yielding on Scheduler 5. Thread creation time: 13141733840753. Approx Thread CPU Used: kernel 0 ms, user 432203 ms. Process Utilization 30%. System Idle 68%. Interval: 496287 ms.
Process 0:0:0 (0x3660) Worker 0x0000014ABFA7A160 appears to be non-yielding on Scheduler 5. Thread creation time: 13141733840753. Approx Thread CPU Used: kernel 15 ms, user 483265 ms. Process Utilization 30%. System Idle 68%. Interval: 556507 ms.
Process 0:0:0 (0x3660) Worker 0x0000014ABFA7A160 appears to be non-yielding on Scheduler 5. Thread creation time: 13141733840753. Approx Thread CPU Used: kernel 15 ms, user 534343 ms. Process Utilization 31%. System Idle 68%. Interval: 616728 ms.
Process 0:0:0 (0x3660) Worker 0x0000014ABFA7A160 appears to be non-yielding on Scheduler 5. Thread creation time: 13141733840753. Approx Thread CPU Used: kernel 15 ms, user 590000 ms. Process Utilization 30%. System Idle 68%. Interval: 676949 ms.
Process 0:0:0 (0x3660) Worker 0x0000014ABFA7A160 appears to be non-yielding on Scheduler 5. Thread creation time: 13141733840753. Approx Thread CPU Used: kernel 15 ms, user 637718 ms. Process Utilization 31%. System Idle 68%. Interval: 737169 ms.
Process 0:0:0 (0x3660) Worker 0x0000014ABFA7A160 appears to be non-yielding on Scheduler 5. Thread creation time: 13141733840753. Approx Thread CPU Used: kernel 15 ms, user 687500 ms. Process Utilization 30%. System Idle 68%. Interval: 797390 ms.
Process 0:0:0 (0x3660) Worker 0x0000014ABFA7A160 appears to be non-yielding on Scheduler 5. Thread creation time: 13141733840753. Approx Thread CPU Used: kernel 15 ms, user 738671 ms. Process Utilization 30%. System Idle 68%. Interval: 857611 ms.
Process 0:0:0 (0x3660) Worker 0x0000014ABFA7A160 appears to be non-yielding on Scheduler 5. Thread creation time: 13141733840753. Approx Thread CPU Used: kernel 31 ms, user 789781 ms. Process Utilization 31%. System Idle 67%. Interval: 917831 ms.
Process 0:0:0 (0x3660) Worker 0x0000014ABFA7A160 appears to be non-yielding on Scheduler 5. Thread creation time: 13141733840753. Approx Thread CPU Used: kernel 31 ms, user 840890 ms. Process Utilization 30%. System Idle 68%. Interval: 978052 ms.
Process 0:0:0 (0x3660) Worker 0x0000014ABFA7A160 appears to be non-yielding on Scheduler 5. Thread creation time: 13141733840753. Approx Thread CPU Used: kernel 31 ms, user 896640 ms. Process Utilization 31%. System Idle 67%. Interval: 1038273 ms.
Process 0:0:0 (0x3660) Worker 0x0000014ABFA7A160 appears to be non-yielding on Scheduler 5. Thread creation time: 13141733840753. Approx Thread CPU Used: kernel 46 ms, user 947703 ms. Process Utilization 31%. System Idle 68%. Interval: 1098509 ms.
Process 0:0:0 (0x3660) Worker 0x0000014ABFA7A160 appears to be non-yielding on Scheduler 5. Thread creation time: 13141733840753. Approx Thread CPU Used: kernel 46 ms, user 1002625 ms. Process Utilization 31%. System Idle 68%. Interval: 1158730 ms.
Process 0:0:0 (0x3660) Worker 0x0000014ABFA7A160 appears to be non-yielding on Scheduler 5. Thread creation time: 13141733840753. Approx Thread CPU Used: kernel 46 ms, user 1054546 ms. Process Utilization 31%. System Idle 68%. Interval: 1218950 ms.
Process 0:0:0 (0x3660) Worker 0x0000014ABFA7A160 appears to be non-yielding on Scheduler 5. Thread creation time: 13141733840753. Approx Thread CPU Used: kernel 46 ms, user 1105359 ms. Process Utilization 31%. System Idle 68%. Interval: 1279171 ms.
Process 0:0:0 (0x3660) Worker 0x0000014ABFA7A160 appears to be non-yielding on Scheduler 5. Thread creation time: 13141733840753. Approx Thread CPU Used: kernel 46 ms, user 1157562 ms. Process Utilization 31%. System Idle 68%. Interval: 1339392 ms.
Process 0:0:0 (0x3660) Worker 0x0000014ABFA7A160 appears to be non-yielding on Scheduler 5. Thread creation time: 13141733840753. Approx Thread CPU Used: kernel 46 ms, user 1203109 ms. Process Utilization 30%. System Idle 68%. Interval: 1399613 ms.
Process 0:0:0 (0x3660) Worker 0x0000014ABFA7A160 appears to be non-yielding on Scheduler 5. Thread creation time: 13141733840753. Approx Thread CPU Used: kernel 46 ms, user 1258703 ms. Process Utilization 31%. System Idle 68%. Interval: 1459818 ms.
Process 0:0:0 (0x3660) Worker 0x0000014ABFA7A160 appears to be non-yielding on Scheduler 5. Thread creation time: 13141733840753. Approx Thread CPU Used: kernel 46 ms, user 1314421 ms. Process Utilization 31%. System Idle 68%. Interval: 1520038 ms.
Process 0:0:0 (0x3660) Worker 0x0000014ABFA7A160 appears to be non-yielding on Scheduler 5. Thread creation time: 13141733840753. Approx Thread CPU Used: kernel 46 ms, user 1365578 ms. Process Utilization 30%. System Idle 68%. Interval: 1580259 ms.
Process 0:0:0 (0x3660) Worker 0x0000014ABFA7A160 appears to be non-yielding on Scheduler 5. Thread creation time: 13141733840753. Approx Thread CPU Used: kernel 46 ms, user 1421359 ms. Process Utilization 30%. System Idle 68%. Interval: 1640480 ms.
Process 0:0:0 (0x3660) Worker 0x0000014ABFA7A160 appears to be non-yielding on Scheduler 5. Thread creation time: 13141733840753. Approx Thread CPU Used: kernel 46 ms, user 1474921 ms. Process Utilization 31%. System Idle 67%. Interval: 1700700 ms.
Process 0:0:0 (0x3660) Worker 0x0000014ABFA7A160 appears to be non-yielding on Scheduler 5. Thread creation time: 13141733840753. Approx Thread CPU Used: kernel 46 ms, user 1528140 ms. Process Utilization 31%. System Idle 68%. Interval: 1760921 ms.
Process 0:0:0 (0x2a28) Worker 0x0000014CB2C4A160 appears to be non-yielding on Scheduler 2. Thread creation time: 13141776512146. Approx Thread CPU Used: kernel 0 ms, user 55703 ms. Process Utilization 35%. System Idle 63%. Interval: 70252 ms.
Process 0:0:0 (0x3660) Worker 0x0000014ABFA7A160 appears to be non-yielding on Scheduler 5. Thread creation time: 13141733840753. Approx Thread CPU Used: kernel 46 ms, user 1574531 ms. Process Utilization 31%. System Idle 67%. Interval: 1821157 ms.
—————————————————————————————
At that time also was executing Azure managed SQL database backup which is encrypted using certificate and compressed and other process NewRelic (3rd party tool for performance recording). From System Health Extended Events *.xel files I saw we had have IO warnings at that time and a lot of PAGEIOLATCH_UP and PAGEIOLATCH_EX, PAGELATCH_SH and PAGELATCH_EX wait latches.
We are using SQL Server 2016 (13.0.4199.0)
My question is :
Could you tell me are these refer to some DP_LIST spinlock problems and also to some tempDB contention and more about recommendations how to fix the issue ?
Thanks a lot in advance !
Well the symptoms certainly look like there’s an issue with the DP_LIST spinlock, but I don’t know of any bugs so you’d need to contact Product Support for assistance there. If you’re able to you could change the checkpoint type away from indirect checkpoints so the dirty page table isn’t involved. For the PAGEIOLATCH_XX and PAGELATCH_XX, see https://www.sqlskills.com/help/waits/pagelatch_ex/ and https://www.sqlskills.com/help/waits/pageiolatch_sh/.
Hello again Paul,
Thank you very much for your suggestion. Changing the checkpoint type away from indirect checkpoints really helped us. We didn’t call Product Support because we waited for this issue to repeat first. But yesterday I came across at one link from Parikshit Savjani and I will share it to you and other readers:
https://blogs.msdn.microsoft.com/sql_server_team/indirect-checkpoint-and-tempdb-the-good-the-bad-and-the-non-yielding-scheduler/
In the link he suggested us to try the same thing you wrote. After setting tempDB parameter TARGET_RECOVERY_TIME to 0 we got all zeroes in the next query: select * from sys.dm_os_spinlock_stats where name =’DP_LIST’.
Best regards !