(Check out my comprehensive library of all wait types and latch classes.)
[Last updated: March 21, 2026]
How many times have you walked up to a SQL Server that has a performance problem and wondered where to start looking?
Check It Out!

One of the most under-utilized performance troubleshooting methodologies in the SQL Server world is one called “waits and queues” (also known as “SQL Server wait statistics” or simply “wait stats”). The basic premise is that SQL Server is permanently tracking why execution threads have to wait. You can ask SQL Server for this information and then use the results to narrow down where to start digging to unearth the cause of performance issues. The “waits” are what SQL Server tracks. The “queues” are the resources that the threads are waiting for. There are a myriad of waits in the system and they all indicate different resources being waited for. For example, a PAGEIOLATCH_EX wait means a thread is waiting for a data page to be read into the buffer pool from disk. An LCK_M_X wait means a thread is waiting to be granted an exclusive lock on something.
The great thing about all of this is the SQL Server *knows* where the performance issues are, and you just need to ask it…. and then interpret what it tells you, which can be a little tricky.
Now – where people sometimes get hung up is trying to track down every last wait and figure out what’s causing it. Waits *always* occur. It’s the way SQL Server’s scheduling system works.
A thread is using the CPU (called RUNNING) until it needs to wait for a resource. It then moves to an unordered list of threads that are SUSPENDED. In the meantime, the next thread on the FIFO (first-in-first-out) queue of threads waiting for the CPU (called being RUNNABLE) is given the CPU and becomes RUNNING. If a thread on the SUSPENDED list is notified that it’s resource is available, it becomes RUNNABLE and is put on the bottom of the RUNNABLE queue. Threads continue this clockwise movement from RUNNING to SUSPENDED to RUNNABLE to RUNNING again until the task is completed. You can see processes in these states using the sys.dm_exec_requests DMV.
SQL Server keeps track of the time that elapses between leaving the RUNNING state and becoming RUNNING again (called the “wait time”) and the time spent on the RUNNABLE queue (called the “signal wait time” – i.e. how long does the thread need to wait for the CPU after being signaled that its resource is available). We need to work out the time spent waiting on the SUSPENDED list (called the “resource wait time”) by subtracting the signal wait time from the overall wait time.
A great resource is the whitepaper on wait statistics: SQL Server Performance Tuning Using Wait Statistics: A Beginners Guide, which I encourage you to read. There’s also a much older whitepaper (Performance Tuning Using Waits and Queues) which has a lot of useful information, but it’s pretty dated now. The best guide to what the various wait types (and latch classes) mean are my comprehensive waits and latches libraries and the methodology of using and understanding wait statistics is described and demonstrated in my Pluralsight online training course.
You should also check out the following categories on my blog for more along these lines:
- Wait Stats
- Latches (more advanced)
- Spinlocks (very advanced)
You can ask SQL Server for the cumulative wait statistics using the sys.dm_os_wait_stats DMV, and many people prefer to wrap the DMV call in some aggregation code. See below for the most recent version of my script, as of 2021, that works on all versions and includes wait types for SQL Server 2019.
Note: This script does NOT work on Azure SQL Database – you need to replace sys.dm_os_wait_stats with sys.dm_db_wait_stats (for a script to use on Azure, see here).
-- Last updated March 21, 2026
WITH [Waits] AS
    (SELECT
        [wait_type],
        [wait_time_ms] / 1000.0 AS [WaitS],
        ([wait_time_ms] - [signal_wait_time_ms]) / 1000.0 AS [ResourceS],
        [signal_wait_time_ms] / 1000.0 AS [SignalS],
        [waiting_tasks_count] AS [WaitCount],
        100.0 * [wait_time_ms] / SUM ([wait_time_ms]) OVER() AS [Percentage],
        ROW_NUMBER() OVER(ORDER BY [wait_time_ms] DESC) AS [RowNum]
    FROM sys.dm_os_wait_stats
    WHERE [wait_type] NOT IN (
        -- These wait types are almost 100% never a problem and so they are
        -- filtered out to avoid them skewing the results. Click on the URL
        -- for more information.
        N'BROKER_EVENTHANDLER', -- https://www.sqlskills.com/help/waits/BROKER_EVENTHANDLER
        N'BROKER_RECEIVE_WAITFOR', -- https://www.sqlskills.com/help/waits/BROKER_RECEIVE_WAITFOR
        N'BROKER_TASK_STOP', -- https://www.sqlskills.com/help/waits/BROKER_TASK_STOP
        N'BROKER_TO_FLUSH', -- https://www.sqlskills.com/help/waits/BROKER_TO_FLUSH
        N'BROKER_TRANSMITTER', -- https://www.sqlskills.com/help/waits/BROKER_TRANSMITTER
        N'CHECKPOINT_QUEUE', -- https://www.sqlskills.com/help/waits/CHECKPOINT_QUEUE
        N'CHKPT', -- https://www.sqlskills.com/help/waits/CHKPT
        N'CLR_AUTO_EVENT', -- https://www.sqlskills.com/help/waits/CLR_AUTO_EVENT
        N'CLR_MANUAL_EVENT', -- https://www.sqlskills.com/help/waits/CLR_MANUAL_EVENT
        N'CLR_SEMAPHORE', -- https://www.sqlskills.com/help/waits/CLR_SEMAPHORE

        -- Maybe comment this out if you have parallelism issues
        N'CXCONSUMER', -- https://www.sqlskills.com/help/waits/CXCONSUMER

        -- Maybe comment these four out if you have mirroring issues
        N'DBMIRROR_DBM_EVENT', -- https://www.sqlskills.com/help/waits/DBMIRROR_DBM_EVENT
        N'DBMIRROR_EVENTS_QUEUE', -- https://www.sqlskills.com/help/waits/DBMIRROR_EVENTS_QUEUE
        N'DBMIRROR_WORKER_QUEUE', -- https://www.sqlskills.com/help/waits/DBMIRROR_WORKER_QUEUE
        N'DBMIRRORING_CMD', -- https://www.sqlskills.com/help/waits/DBMIRRORING_CMD
        N'DIRTY_PAGE_POLL', -- https://www.sqlskills.com/help/waits/DIRTY_PAGE_POLL
        N'DISPATCHER_QUEUE_SEMAPHORE', -- https://www.sqlskills.com/help/waits/DISPATCHER_QUEUE_SEMAPHORE
        N'EXECSYNC', -- https://www.sqlskills.com/help/waits/EXECSYNC
        N'FSAGENT', -- https://www.sqlskills.com/help/waits/FSAGENT
        N'FT_IFTS_SCHEDULER_IDLE_WAIT', -- https://www.sqlskills.com/help/waits/FT_IFTS_SCHEDULER_IDLE_WAIT
        N'FT_IFTSHC_MUTEX', -- https://www.sqlskills.com/help/waits/FT_IFTSHC_MUTEX

       -- Maybe comment these six out if you have AG issues
        N'HADR_CLUSAPI_CALL', -- https://www.sqlskills.com/help/waits/HADR_CLUSAPI_CALL
        N'HADR_FILESTREAM_IOMGR_IOCOMPLETION', -- https://www.sqlskills.com/help/waits/HADR_FILESTREAM_IOMGR_IOCOMPLETION
        N'HADR_LOGCAPTURE_WAIT', -- https://www.sqlskills.com/help/waits/HADR_LOGCAPTURE_WAIT
        N'HADR_NOTIFICATION_DEQUEUE', -- https://www.sqlskills.com/help/waits/HADR_NOTIFICATION_DEQUEUE
        N'HADR_TIMER_TASK', -- https://www.sqlskills.com/help/waits/HADR_TIMER_TASK
        N'HADR_WORK_QUEUE', -- https://www.sqlskills.com/help/waits/HADR_WORK_QUEUE

        N'KSOURCE_WAKEUP', -- https://www.sqlskills.com/help/waits/KSOURCE_WAKEUP
        N'LAZYWRITER_SLEEP', -- https://www.sqlskills.com/help/waits/LAZYWRITER_SLEEP
        N'LOGMGR_QUEUE', -- https://www.sqlskills.com/help/waits/LOGMGR_QUEUE
        N'MEMORY_ALLOCATION_EXT', -- https://www.sqlskills.com/help/waits/MEMORY_ALLOCATION_EXT
        N'ONDEMAND_TASK_QUEUE', -- https://www.sqlskills.com/help/waits/ONDEMAND_TASK_QUEUE
        N'PARALLEL_REDO_DRAIN_WORKER', -- https://www.sqlskills.com/help/waits/PARALLEL_REDO_DRAIN_WORKER
        N'PARALLEL_REDO_LOG_CACHE', -- https://www.sqlskills.com/help/waits/PARALLEL_REDO_LOG_CACHE
        N'PARALLEL_REDO_TRAN_LIST', -- https://www.sqlskills.com/help/waits/PARALLEL_REDO_TRAN_LIST
        N'PARALLEL_REDO_WORKER_SYNC', -- https://www.sqlskills.com/help/waits/PARALLEL_REDO_WORKER_SYNC
        N'PARALLEL_REDO_WORKER_WAIT_WORK', -- https://www.sqlskills.com/help/waits/PARALLEL_REDO_WORKER_WAIT_WORK
        N'PREEMPTIVE_OS_FLUSHFILEBUFFERS', -- https://www.sqlskills.com/help/waits/PREEMPTIVE_OS_FLUSHFILEBUFFERS
        N'PREEMPTIVE_XE_GETTARGETSTATE', -- https://www.sqlskills.com/help/waits/PREEMPTIVE_XE_GETTARGETSTATE
        N'PVS_PREALLOCATE', -- https://www.sqlskills.com/help/waits/PVS_PREALLOCATE
        N'PWAIT_ALL_COMPONENTS_INITIALIZED', -- https://www.sqlskills.com/help/waits/PWAIT_ALL_COMPONENTS_INITIALIZED
        N'PWAIT_DIRECTLOGCONSUMER_GETNEXT', -- https://www.sqlskills.com/help/waits/PWAIT_DIRECTLOGCONSUMER_GETNEXT
        N'PWAIT_EXTENSIBILITY_CLEANUP_TASK', -- https://www.sqlskills.com/help/waits/PWAIT_EXTENSIBILITY_CLEANUP_TASK
        N'QDS_PERSIST_TASK_MAIN_LOOP_SLEEP', -- https://www.sqlskills.com/help/waits/QDS_PERSIST_TASK_MAIN_LOOP_SLEEP
        N'QDS_ASYNC_QUEUE', -- https://www.sqlskills.com/help/waits/QDS_ASYNC_QUEUE
        N'QDS_CLEANUP_STALE_QUERIES_TASK_MAIN_LOOP_SLEEP',
            -- https://www.sqlskills.com/help/waits/QDS_CLEANUP_STALE_QUERIES_TASK_MAIN_LOOP_SLEEP
        N'QDS_SHUTDOWN_QUEUE', -- https://www.sqlskills.com/help/waits/QDS_SHUTDOWN_QUEUE
        N'REDO_THREAD_PENDING_WORK', -- https://www.sqlskills.com/help/waits/REDO_THREAD_PENDING_WORK
        N'REQUEST_FOR_DEADLOCK_SEARCH', -- https://www.sqlskills.com/help/waits/REQUEST_FOR_DEADLOCK_SEARCH
        N'RESOURCE_QUEUE', -- https://www.sqlskills.com/help/waits/RESOURCE_QUEUE
        N'SERVER_IDLE_CHECK', -- https://www.sqlskills.com/help/waits/SERVER_IDLE_CHECK
        N'SLEEP_BPOOL_FLUSH', -- https://www.sqlskills.com/help/waits/SLEEP_BPOOL_FLUSH
        N'SLEEP_DBSTARTUP', -- https://www.sqlskills.com/help/waits/SLEEP_DBSTARTUP
        N'SLEEP_DCOMSTARTUP', -- https://www.sqlskills.com/help/waits/SLEEP_DCOMSTARTUP
        N'SLEEP_MASTERDBREADY', -- https://www.sqlskills.com/help/waits/SLEEP_MASTERDBREADY
        N'SLEEP_MASTERMDREADY', -- https://www.sqlskills.com/help/waits/SLEEP_MASTERMDREADY
        N'SLEEP_MASTERUPGRADED', -- https://www.sqlskills.com/help/waits/SLEEP_MASTERUPGRADED
        N'SLEEP_MSDBSTARTUP', -- https://www.sqlskills.com/help/waits/SLEEP_MSDBSTARTUP
        N'SLEEP_SYSTEMTASK', -- https://www.sqlskills.com/help/waits/SLEEP_SYSTEMTASK
        N'SLEEP_TASK', -- https://www.sqlskills.com/help/waits/SLEEP_TASK
        N'SLEEP_TEMPDBSTARTUP', -- https://www.sqlskills.com/help/waits/SLEEP_TEMPDBSTARTUP
        N'SNI_HTTP_ACCEPT', -- https://www.sqlskills.com/help/waits/SNI_HTTP_ACCEPT
        N'SOS_WORK_DISPATCHER', -- https://www.sqlskills.com/help/waits/SOS_WORK_DISPATCHER
        N'SP_SERVER_DIAGNOSTICS_SLEEP', -- https://www.sqlskills.com/help/waits/SP_SERVER_DIAGNOSTICS_SLEEP
        N'SQLTRACE_BUFFER_FLUSH', -- https://www.sqlskills.com/help/waits/SQLTRACE_BUFFER_FLUSH
        N'SQLTRACE_INCREMENTAL_FLUSH_SLEEP', -- https://www.sqlskills.com/help/waits/SQLTRACE_INCREMENTAL_FLUSH_SLEEP
        N'SQLTRACE_WAIT_ENTRIES', -- https://www.sqlskills.com/help/waits/SQLTRACE_WAIT_ENTRIES
        N'VDI_CLIENT_OTHER', -- https://www.sqlskills.com/help/waits/VDI_CLIENT_OTHER
        N'WAIT_FOR_RESULTS', -- https://www.sqlskills.com/help/waits/WAIT_FOR_RESULTS
        N'WAITFOR', -- https://www.sqlskills.com/help/waits/WAITFOR
        N'WAITFOR_TASKSHUTDOWN', -- https://www.sqlskills.com/help/waits/WAITFOR_TASKSHUTDOWN
        N'WAIT_XTP_RECOVERY', -- https://www.sqlskills.com/help/waits/WAIT_XTP_RECOVERY
        N'WAIT_XTP_HOST_WAIT', -- https://www.sqlskills.com/help/waits/WAIT_XTP_HOST_WAIT
        N'WAIT_XTP_OFFLINE_CKPT_NEW_LOG', -- https://www.sqlskills.com/help/waits/WAIT_XTP_OFFLINE_CKPT_NEW_LOG
        N'WAIT_XTP_CKPT_CLOSE', -- https://www.sqlskills.com/help/waits/WAIT_XTP_CKPT_CLOSE
        N'XE_DISPATCHER_JOIN', -- https://www.sqlskills.com/help/waits/XE_DISPATCHER_JOIN
        N'XE_DISPATCHER_WAIT', -- https://www.sqlskills.com/help/waits/XE_DISPATCHER_WAIT
        N'XE_TIMER_EVENT' -- https://www.sqlskills.com/help/waits/XE_TIMER_EVENT
        )
    AND [waiting_tasks_count] > 0
    )
SELECT
    MAX ([W1].[wait_type]) AS [WaitType],
    CAST (MAX ([W1].[WaitS]) AS DECIMAL (16,2)) AS [Wait_S],
    CAST (MAX ([W1].[ResourceS]) AS DECIMAL (16,2)) AS [Resource_S],
    CAST (MAX ([W1].[SignalS]) AS DECIMAL (16,2)) AS [Signal_S],
    MAX ([W1].[WaitCount]) AS [WaitCount],
    CAST (MAX ([W1].[Percentage]) AS DECIMAL (5,2)) AS [Percentage],
    CAST ((MAX ([W1].[WaitS]) / MAX ([W1].[WaitCount])) AS DECIMAL (16,4)) AS [AvgWait_S],
    CAST ((MAX ([W1].[ResourceS]) / MAX ([W1].[WaitCount])) AS DECIMAL (16,4)) AS [AvgRes_S],
    CAST ((MAX ([W1].[SignalS]) / MAX ([W1].[WaitCount])) AS DECIMAL (16,4)) AS [AvgSig_S],
    CAST ('https://www.sqlskills.com/help/waits/' + MAX ([W1].[wait_type]) as XML) AS [Help/Info URL]
FROM [Waits] AS [W1]
INNER JOIN [Waits] AS [W2] ON [W2].[RowNum] <= [W1].[RowNum]
GROUP BY [W1].[RowNum]
HAVING SUM ([W2].[Percentage]) - MAX( [W1].[Percentage] ) < 95; -- percentage threshold
GO
This will show the waits grouped together as a percentage of all waits on the system, in decreasing order. The waits to be concerned about (potentially) are those at the top of the list as this represents the majority of where SQL Server is spending it’s time waiting. You can see that a bunch of waits are being filtered out of consideration – as I said above, waits happen all the time and these are the benign ones we can usually ignore.
You can also reset the aggregated statistics using this code:
DBCC SQLPERF (N'sys.dm_os_wait_stats', CLEAR);
GO
And of course you can very easily come up with a way to persist the results every few hours or every day and do some time-series analysis to figure out trends or automatically spot problems as they start to happen. On SQL Server 2000 you can use DBCC SQLPERF (N’waitstats’), and most 3rd-party performance monitoring tools show you wait statistics too.
Once you get the results, you then start figuring out how to interpret them and where to go looking. The best place to find detailed information on the waits reported is in my comprehensive library of all wait types and latch classes and I’ve also blogged a lot on my wait statistics category.
For now, I want to report on the results of the wait stats survey I posted a couple of months back. I asked people to run the original version of the large query above and let me know the results. I received results for a whopping 1,823 SQL Servers out there – thank you!
Here’s a graphical view of the results:
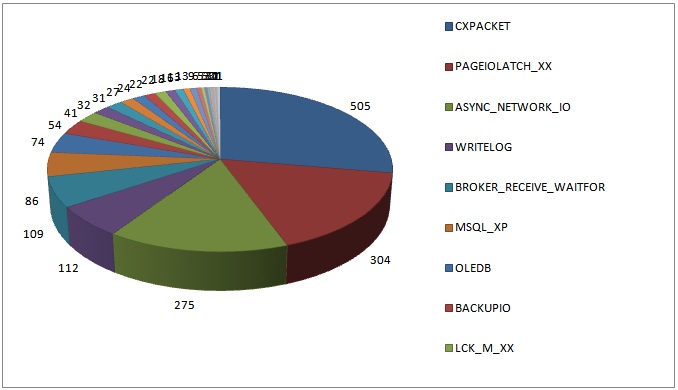
I’m not surprised at all by the top four results as I see these over and over on client systems.
The list below shows all the waits reported in the survey results, along with a clickable link that will take you to the wait’s page in my waits library. I did another survey in 2014 that showed some interesting changes – see here for details.
For the remainder of this post, I’m going to list all the top wait types reported by survey respondents, in descending order, and give a few words about what they might mean if they are the most prevalent wait on your system. The list format shows the number of systems with that wait type as the most prevalent, and then the wait type.
Make sure you also check out the more recent post What is the most worrying wait type? for more in-depth and up-to-date information.
For all these wait types, you can click the name of the wait to go to its entry in the new wait stats library I released in May 2016.
- 505: CXPACKET
- 304: PAGEIOLATCH_XX
- 275: ASYNC_NETWORK_IO
- 112: WRITELOG
- 109: BROKER_RECEIVE_WAITFOR
- 086: MSQL_XP
- 074: OLEDB
- 054: BACKUPIO
- 041: LCK_M_XX
- 032: ONDEMAND_TASK_QUEUE
- 031: BACKUPBUFFER
- 027: IO_COMPLETION
- 024: SOS_SCHEDULER_YIELD
- 022: DBMIRROR_EVENTS_QUEUE
- 022: DBMIRRORING_CMD
- 018: PAGELATCH_XX
- 016: LATCH_XX
- 013: PREEMPTIVE_OS_PIPEOPS
- 013: THREADPOOL
- 009: BROKER_TRANSMITTER
- 006: SQLTRACE_WAIT_ENTRIES
- 005: DBMIRROR_DBM_MUTEX
- 005: RESOURCE_SEMAPHORE
- 003: PREEMPTIVE_OS_AUTHENTICATIONOPS
- 003: PREEMPTIVE_OS_GENERICOPS
- 003: SLEEP_BPOOL_FLUSH
- 002: MSQL_DQ
- 002: RESOURCE_SEMAPHORE_QUERY_COMPILE
- 001: DAC_INIT
- 001: MSSEARCH
- 001: PREEMPTIVE_OS_FILEOPS
- 001: PREEMPTIVE_OS_LIBRARYOPS
- 001: PREEMPTIVE_OS_LOOKUPACCOUNTSID
- 001: PREEMPTIVE_OS_QUERYREGISTRY
- 001: SQLTRACE_LOCK
I hope you found this interesting! Let me know if there’s anything in particular you’re interested in seeing or just that you’re following along and enjoying the ride!
137 thoughts on “SQL Server Wait Statistics (or please tell me where it hurts…)”
WoW … amazing post … This makes me feel allot better about my efforts at performance tuning over the past couple of months, I fall pretty much in line with these wait states. This also clarified allot of little points that the tech net descriptions kind of glosses over. I’ve been thinking that a server I’ve been working on was under CPU pressure, the tech net article says of SOS_SCHEDULER_YIELD "Occurs when a task voluntarily yields the scheduler for other tasks to execute. During this wait the task is waiting for its quantum to be renewed." ~ errr (sounds like a fortune cookie) but after working out allot of this is one of my top waits states.
BROKER_RECEIVE_WAITFOR: probably some of the surveyed sites were using SqlDependency and/or SqlCacheDependency.
This is very useful information. I’ll be sharing this article with my team tomorrow and look forward to the future wait stat analysis posts. Thanks!
This is a great summary. I look forward to reading your future blogs on LATCH_XX wait tracing specifically the cause of Latch_EX waits under heavy load as this has been a thorn in my side for some time.
Hi Paul, thanks for explaining this as you have, its great to be able to get some background on this sort of topic. I have tried the script on some of my servers here and have at the top of my list on one of them a Wait Type of DBMIRROR_DBM_EVENT which is explained in BOL as "Identified for informational purposes only. Not supported. Future compatibility is not guaranteed.". 4th in order on the same server is DBMIRROR_WORKER_QUEUE
with BOL saying "Indicates that the database mirroring worker task is waiting for more work." from that explanation I think I should be adding that to the excluded list but what should I do about the DBMIRROR_DBM_EVENT waits, is there any cause for concern or should I exclude that from the results too?
Great post Paul. Time series analysis really helps to understand the baseline of the system. Looking forward to read the post about it
Hi Jonathan – I’d remove those from consideration as well. Cheers
Another nice post about a very relevant subject that seems to still be a mystery to so many people.
Thanks for the mention!
Great Article.
Thanks for another great labor of love, Paul. You explain these things in a way that even I can understand!
Good Information on waits Statistics..
Fantastic post, Paul – that’s the best presentation of wait types I have seen and should give us all no excuses for not applying this troubleshooting methodology more rigorously.
I have one query about the DBMIRROR_DBM_EVENT wait type. This showed up on one of our systems last year as the lead wait type. After an exhaustive Premier Support Call, we were directed to two issues: this wait type can be symptomatic of an issue where the DBM thread is blocked because the checkpoint process does not yield sufficiently frequently (hence the DBMIRROR_DBM_EVENT wait) – this was a problem apparently fixed in SQL Server 2005 SP3 CU10; alternatively, it can also be symptomatic of throttling of the send rate for the log via the DbmFlowControl::ControlFlow function. Either way, it might be useful not to filter out DBMIRROR_DBM_EVENT as it can indirectly point to system bottlenecks.
Thanks a million for this post. I’ve often searched around for descriptions of the various core elements but it is rare you find something described as accessible as this.
Thank you.
@Donald Interesting info – it’s similar in that respect to the DBMIRROR_DBM_MUTEX counter. Thanks
DBMIRROR_DBM_EVENT waits can normally be ignored on systems where Database Mirroring is not configured. But if you have mirroring configured and you are seeing the waittime showing abnormally high values on the Principal or Mirror instances, then it could point to database mirroring synchronization taking a long time due to slow IO, other blocking tasks preventing the mirroring threads from continuing further or network latency. The issues that we addressd for Database Mirroring in SQL 2005 SP3 CU10 were for some issues that we identified and additioanl diagnostic information to be printed in the SQL errorlog for mirroring related issues. The manifestation for all these issues would show up as one of the database mirroring waittypes. The common one is: DBMIRROR_DBM_EVENT.
Interesting. Thanks.
Hi Paul, best article about wait stats I ever read. The reference links are also very helpful.
I have seen CXPACKET as the biggest wait on some of our servers. Does anyone has a good method to find out the offending parallel queries? Thanks!
I’d encourage the SQL Server folks to read up on Cary Millsap’s Method R work. All about constraint theory and waits.
Very nice article, though i read this article very late it was interesting and given me alot more indepth knowledge about my system lock waits… Thanks alot
Paul,
Thanks for an excellent blog post! There’s a ton of awesome information in here and I’ll definitely be refering to this in the future.
— Adam
Do you have any sort of rule of thumb for when a wait should be considered troublesome or when you should start looking deeper? Running your code on my server shows the biggest wait (60%) to be dbmirror_worker_queue, which can be ignored. The next two waits constitute 9% and 8% of the total wait time. (And the 8% one is dbmirror_send, which I would expect, since I pause mirroring on a 9 GB db while doing DBCC index maintenance, then resume mirroring and it takes about 3 hours for the mirror to become synchronized again). The others are 3% or less of total wait times. Server is running fine and I have no performance complaints from my users, but I’m just trying to be proactive. I would guess anything over 10%-15% of total wait time would warrant a closer look..
Hi Shaun – anything that’s at the top of the list warrants investigation, but bear in mind that waits are normal and there may be waits you can do nothing about – especially if the system is performing well like you say. Filter out the DBM ones and re-run the query – see what you find then. Cheers
As usual nice survey paul .good collection thanks.
Thanks For the Article. I have a server with waits on PREEMPTIVE_OS_WAITFORSINGLEOBJECT. Can you please guide me on this wait.
A quick Google search shows this: http://social.msdn.microsoft.com/Forums/en/sqldatabaseengine/thread/1bf2c509-568e-47fd-8413-67770ecda025
I had similar CXPACKET wait issues about a year ago. A senior co-worker looked at my code, and mentioned the waits were most likely being generated by my joining of large table variables (> 1000 rows) because the plan views a table variable as a single row, which could cause the optimizer to give unequal amounts of work to parallel processes. When I switched to using temp tables for larger sets of generated data, the CXPACKET waits dissapeared for the particular query.
Check the code running behind the CXPACKET wait. Look for joins on table variables, and see if you can analyze their approximate row count.
Paul, I love this post
No one SQL Server tuner in this universe cant escape from your blogs especially this one
Hi Paul. Thanks for this great post.
Could a fragmented log file, with a lot of VLFs, be related to a high writelog wait?
Regards
Possibly a contributor but unlikely to be the root cause.
Hi Paul,
I want to know, are Inner join and cross apply are RBAR or not? Please justify.
How is this relevant to wait stats?
Yeah obviously it is not relevant to wait stats.
By mistake I have posted my question here, sorry for that.
But still, can you answer it Because I didn’t get any of your articles about RBAR.
I haven’t written any articles about query operator internals – that’s not my area. The term RBAR only applies to applications or T-SQL code that process rows one-by-set instead of either caching results or using set-based operations, respectively.
Paul, I am curious about your statement on a BACKUPIO wait. “This shows up when you’re backing up directly to tape, which is slooooow. I’d be tempted to filter this out.” If this is a significant percentage of wait time, wouldn’t it make sense to look into disk backup or faster tape drives? Thanks.
You could, but if you’re stuck with direct-to-tape, I’d filter it out. Even fast tape drives are still going to be slower than going to disk, and many people don’t have the disk space to go two-step to disk and then off-disk. But a fair point.
On the subject of the BACKUPIO wait, what if you’re getting this while you’re backing up a 2TB db to SAN disk across 5 LUNs, wouldn’t that indicate a problem? Couple that with regular PAGEIOLATCH_SH waits that are consistantly 60% or more of the waits through out the day, and I’m inclined to think there’s a problem with the SAN. Is that a fair assumption that I should delve into further?
Thanks,
jh
If the BACKUPIO waits are on average longer than you expect, then the I/O isn’t as efficient as you want and should be investigated. I’m carefully not saying that there’s a SAN problem, as it could be a myriad things wrong.
PAGEIOLATCH_SH doesn’t necessarily indicate an I/O subsystem problem. First question – why are physical reads being done in the first place? Why isn’t the workload in memory? Are query plans driving more I/O than they should? etc.
Paul I just recently started seeing high OLE DB wait types. Now during those times we have our index rebuild script running as maintenance job. Could that be what’s causing the OLEDB waits?
No – it’s the sys.dm_db_index_physical_stats DMV. DMVs use OLE DB under the covers. Cheers
Hello Paul,
Thank you for this Glenn Berry modified script, I use it frequently. Need some clarification. The main part of this I like the best is we weed out the benign waits and can focus on what might actually be a problem, but I think interpretation of the percentage column is misleading. You state the script will “show the waits grouped together as a percentage of all waits on the system in descending order”. It actually shows the waits grouped together as a percentage of the non-benign wait time, so all that benign wait time has not been factored in. I run this and it shows CXPACKET as 47% of the non-benign waits. But if I consider the whole time, which means adding in the benign time SQL waited, CXPACKET accounted for 3% of total time waiting. I think that is more accurate. Holler if I’m misinterpreting that, thanks!
Hi Mike – my way is the correct and accepted way. The reason is that some of the benign waits accrue a very large amount of time, dwarfing the non-benign waits as you saw. Because the benign waits always occur and always accrue lots of time, it is generally safe to ignore these and pretend the don’t exist, as the script does. Hope this helps.
Great Article …
Great post!
My top 5 wait types are:
cxpacket 35.57%
resource_semaphore 12.69%
lck_m_x 7.81%
oldedb 7.52%
lck_m_u 6.74%
Any hint what to do next? We get blocking and low memory alerts. Thanks!
Look at the query plans for those queries that have CXPACKET waits and see whether they’re correct, and the statistics for the tables/indexes being processed are up to date.
RESOURCE_SEMAPHORE waits: you need to see which plans are waiting for large memory grants as these a likely incorrect plans for some reason. Look in sys.dm_exec_query_memory_grants
Hi Paul,
This is follow up from a separate email thread i asked regarding ASYNC_NETWORK_IO wait type from one of your newsletters (its almost 2.5 min avg wait time). You asked me to provide the output of the waitstats script, and here it is:
WaitType	Wait_S	Resource_S	Signal_S	WaitCount	Percentage	AvgWait_S	AvgRes_S	AvgSig_S

CXPACKET	316520.74	279519.39	37001.35	79265677	44.14	0.0040	0.0035	0.0005

OLEDB	97706.62	97706.62	0.00	5125028113	13.63	0.0000	0.0000	0.0000

PAGEIOLATCH_SH	53409.05	53194.78	214.27	10330548	7.45	0.0052	0.0051	0.0000

BACKUPIO	34581.80	34493.29	88.51	7275243	4.82	0.0048	0.0047	0.0000

ASYNC_IO_COMPLETION	33451.22	33451.22	0.01	230	4.67	145.4401	145.4401	0.0000

BACKUPBUFFER	28729.38	28038.97	690.41	12534791	4.01	0.0023	0.0022	0.0001

LATCH_EX	28245.93	23894.09	4351.84	58297498	3.94	0.0005	0.0004	0.0001

PAGELATCH_EX	26677.23	4862.10	21815.13	6006699627	3.72	0.0000	0.0000	0.0000

IO_COMPLETION	19645.24	19612.16	33.08	9283896	2.74	0.0021	0.0021	0.0000

WRITELOG	15612.81	15429.14	183.66	4666272	2.18	0.0033	0.0033	0.0000

MSQL_XP	15158.88	15158.88	0.00	2383827	2.11	0.0064	0.0064	0.0000

PREEMPTIVE_OS_GETPROCADDRESS	15125.38	15125.38	0.00	2383827	2.11	0.0063	0.0063	0.0000
Check whether you instant file initialization enabled and then I’d look to see what your parallel plans are doing – could be parallel table scans that you don’t want.
GREAT Post! Thanks a lot!
but Randal, please.
I’m having the PREEMPTIVE_DEBUG wait type in my client. What is it and what can I do ?
Thanks again!
sorry, client = Customer*
Your Customer is making you wait because they want you to Debug code you haven’t written yet?
Hey Paul, I notice that in your article above, you mention the following:
“Make sure that if you have a NUMA system that you try setting MAXDOP to the number of cores in a single NUMA node first to see if that helps the problem.”
However in 2008 SQL Server (and I believe in the later versions as well) the SQL Scheduler attempts to balance workloads across NUMA but it doesn not ensure parallel threads execute on the SAME NUMA node. Linchi Shea has an excellent article about that here:
http://www2.sqlblog.com/blogs/linchi_shea/archive/2012/01/28/no-respect-numa-affinity-meets-query-parallelism.aspx
He also goes on to say that it doesn’t appear to make a huge difference in terms of performance for the remote memory lookups either if parallel threads run on seperate NUMA nodes.
http://sqlblog.com/blogs/linchi_shea/archive/2012/01/30/performance-impact-the-cost-of-numa-remote-memory-access.aspx
I’ve actually found a lot better luck with manually setting processor and IO affinity mask, making sure that no core shares both SQL and IO affinity, and making sure that each NUMA node has the same number of cores dedicated to SQL and IO affinity. In addition I’ve turned on resource governor to the default settings making sure that the buffer cache gets trimmed using the 25% default workload rule.
Then I set up maxdop using the formula widely seen on the internet to divide the number of cores by the number of hyperthreads and never to exceed 8 (again this is just a baseline to get started with testing)
SELECT CASE
WHEN cpu_count / hyperthread_ratio > 8 then 8
ELSE cpu_count / hyperthread_ratio
END AS ‘Optimal Maxdop Setting’
FROM sys.dm_os_sys_info
I also have set my cost threshold for parallelism to 30 (works best for my workload).
Finally, and a lot of people may not realize this, one thing to really tune your parallelism on your database you really have to watch are your statistics. As reccomended, its always a good idea to have auto create and auto update stats turned on (I do mine async). However, many may not realize that auto created stats may be duplicates at the column level. This not only adds time to your maintenance process to keep all those stats updated, but it adds massive time to query processing and parallelism. The optimizer has to work double time to process through those stat objects with slightly different heuristics and certainly this adds to overhead in CXPacket wait.
Matt Bowler has an awesome little script that will go down to the column level and find all the automatically created stats objects which are duplicates of other stats on the table. Using this, you can actually safely drop those stats at the beginning of your maintenance cycle (with testing of course) but doing so really helps to keep the optimizer running optimally and cut down on those CXPacket waits.
http://mattsql.wordpress.com/2013/08/28/duplicate-statistics/
Finally, if you have partitioned tables, another help is to make sure you set the lock escalation on those partitioned tables to AUTO (believe it or not AUTO is not the default). A large table locked for scan can invoke a parallel scan against the clustered index unneccesarily, especially if a partition scan is only required. By setting to AUTO, you allow the optimizer to make intelligent decisions about parallelism. In our environment, I actually create filtered stats down to each partition by the partition key (since most of my tables are read once the data is inserted). This really helps with performance as well.
Of course if you have uneven partitions, and there are fewer than 10,000 rows in that partition, the filtered stat will actually not contain any values. In this case, SQL always does a scan because frankly, its faster.
Feel free to pick this apart (or provide clarity) but I think this might be helpful to someone… I plan on writing a good article about all my findings (and why at some point you should consider PDW 2012 for certain workloads).
I added “,*” to your dm_os_sys_info query. How can I trust a view who’s virtual memory (8TB) is about 35 times bigger than my hard-drive which is almost 100 times bigger than my RAM? (That’s rhetorical, if I bought an 8TB drive add-on, it could create that much VM in theory. Just surprising, remembering SQL 2000 had a 4GB VM limit.)
Hello Paul,
Nice topic and I am little bit confuse .
Which value consider in performance like WaitCount , Percentage ,AvgWait_S , AvgRes_S , AvgSig_S ( High resource) ?
What is base line value ? means How to decide which counter high ?
Please help me
Thanks,
Understanding all of what you’re asking is quite a bit of work. I recommend you watch my Troubleshooting Performance with Wait Statistics course on Pluralsight where I explain all of this. Way too much to go into in a blog comment.
Hello Paul,
Ideally what is frequency of collect wait stat value like 10 min or hour ?
Please give me guide line .
Thanks
There is no best practice – it entirely depends what granularity you want to be able to see changes at. I think every half-hour is a good starting point, but you may want more or less frequently.
Hey Paul, awesome article! I’m curious about the PREEMPTIVE_OS_DELETESECURITYCONTEXT wait type in particular. Using your query, this wait type returns as the highest wait type (by a long shot) on a couple of our client’s systems. What does this typically indicate? Very little documentation on this wait type. Can it be considered benign?
Googling for DeleteSecurityContext gives http://msdn.microsoft.com/en-us/library/windows/desktop/aa375354(v=vs.85).aspx. We’d need to look with Extended Events to see where it’s being used – I’ll be blogging how to do that this week. Watch my blog…
Thank you for the article, you were just referenced in a LinkedIn post. I’ll have to read this over carefully to get the full impact, but one of the things I noticed is that this by default orders the total wait time in descending order (Probably because of the ROW_NUMBER function, not because of your specifying an order on the command itself.)
I’m on a fairly idle system, so I don’t care about waits, but if I did, I’d want to look at something I cared about.
I took out the semi-colon in your command and added
order by AvgWait_S desc
That put the top two in the list down in 9th and 13th place out of 15. The new top 4 had been executed once each. But I want to see what affects overall health so I’m more interested in the things being impacted more often than the one-off commands that could be scheduled to run off-hours because it is a known resource hog.
PS Personal habit is to not use ; in general, so I always preface WITH with a semi-colon because that’s the only command that cares that the previous command is officially terminated.
It’s by design that they’re ordered that way as that gives the highest impact waits first, and that’s what we’re usually interested in for perf tuning.
True, I’m on an idle system and I’m usually looking at the execution costs that can give more bang for the buck, not wait times. Both overall cost and per use cost fit in, but a very high use statement that performs poorly will stand out more sorting by overall cost. Wait times will do the same thing, so you are right.
I like to keep good ideas in a maintenance DB, so:
–use MaintDB
–Create table IgnoreWaitTypes(name nvarchar(200) primary key)
–GO
–insert dbo.IgnoreWaitTypes values (‘BROKER_EVENTHANDLER’),(‘BROKER_RECEIVE_WAITFOR’),(‘BROKER_TASK_STOP’),(‘BROKER_TO_FLUSH’)
The above insert of course has all the wait_types you mentioned in the NOT IN list. The view is quite a bit shorter:
ALTER VIEW [dbo].[Vw_Waits]
AS
WITH [Waits] AS
(SELECT
[wait_type],
[wait_time_ms] / 1000.0 AS [WaitS],
([wait_time_ms] – [signal_wait_time_ms]) / 1000.0 AS [ResourceS],
[signal_wait_time_ms] / 1000.0 AS [SignalS],
[waiting_tasks_count] AS [WaitCount],
100.0 * [wait_time_ms] / SUM ([wait_time_ms]) OVER() AS [Percentage],
ROW_NUMBER() OVER(ORDER BY [wait_time_ms] DESC) AS [RowNum]
FROM sys.dm_os_wait_stats w
LEFT JOIN dbo.IgnoreWaitTypes i ON i.name=w.wait_type
WHERE i.name IS NULL
)
SELECT
[W1].[wait_type] AS [WaitType],
CAST ([W1].[WaitS] AS DECIMAL (16, 2)) AS [Wait_S],
CAST ([W1].[ResourceS] AS DECIMAL (16, 2)) AS [Resource_S],
CAST ([W1].[SignalS] AS DECIMAL (16, 2)) AS [Signal_S],
[W1].[WaitCount] AS [WaitCount],
CAST ([W1].[Percentage] AS DECIMAL (5, 2)) AS [Percentage],
CAST (([W1].[WaitS] / [W1].[WaitCount]) AS DECIMAL (16, 4)) AS [AvgWait_S],
CAST (([W1].[ResourceS] / [W1].[WaitCount]) AS DECIMAL (16, 4)) AS [AvgRes_S],
CAST (([W1].[SignalS] / [W1].[WaitCount]) AS DECIMAL (16, 4)) AS [AvgSig_S]
FROM [Waits] AS [W1]
INNER JOIN [Waits] AS [W2]
ON [W2].[RowNum] <= [W1].[RowNum]
GROUP BY [W1].[RowNum], [W1].[wait_type], [W1].[WaitS],
[W1].[ResourceS], [W1].[SignalS], [W1].[WaitCount], [W1].[Percentage]
HAVING SUM ([W2].[Percentage]) – [W1].[Percentage] < 95 — percentage threshold
That of course, also improves the performance of this query too. Because in Big O terms, yours is N^2 while my version is N LogN. You can't really tell here because the N is so small but on large numbers the JOIN on an indexed field is super fast compared to IN.
Note that you could begin a transaction, truncate the table, select from the view and rollback the transaction to see all the wait types. or delete select ones, insert others, etc.
Excellent article (I can also vouch for Paul’s Pluralsight course).
The top 2 waits on one of my servers are OLEDB and TRACEWRITE making up 48 and 46% respectively.
Apparently (Pinal Dave) TRACEWRITE is harmless and I imagine (read: guess) the OLEDB will be coming from my performance monitoring software (SQL Sentry)
Yes, TRACEWRITE can usually be ignored. If the OLEDB are very tiny, less than 1ms, and there are tens of millions of them, then it is likely DMV execution from monitoring software. Otherwise it could be ad hoc DMV execution, DBCC CHECK*, or actual inked server queries. Could also be SSIS too.
I am getting multiple rows returned for the same WaitType, but with different WaitCounts when running this query in SQL Server 2014. Has anyone else experienced this?
Hi Paul,
In my instance we have one and only one wait_type coming after executing your query…
REDO_THREAD_PENDING_WORK 2759.85 2752.98 6.87 28060 96.45 0.0984 0.0981 0.0002
I googled and foogled, but no valuable answer.
Please help.
Strange – the first result on Google has the info you need. It means the redo threads on the AG secondary are waiting for work to do.
Is this a wait that should be added to the excluded list?
Which wait type? Not sure what you’re referring to.
REDO_THREAD_PENDING_WORK
Hi Paul,
Same behavior as mentioned above with SQL 2014 RTM (getting multiple rows returned for the same WaitType, but with different WaitCounts).
The 2014 optimizer (new cardinality estimator) seems to be the cause, it works with :
– OPTION (QUERYTRACEON 9481) for the request
– or use a temporary table instead of CTE
Hı Paul,
Thanks for this enlightening article. However, I would like to ask whether this running-suspended-runnable line is one way. Let me explain with a scenario: While a task has been moved from suspended to runnable, another task on another processor goes to running and locks the resource one more time. What happens when it’s the former task’s turn to run on its own processor, will it move to the suspended or to the bottom of the runnable queue?
It sounds to me like it will have to cycle again but asking just to be sure.
Thanks a lot.
That can’t happen – when the first task goes to runnable, it owns the resource, so the second task can’t lock it. The second task would go suspended.
Great, thank you. I thought lock would be acquired when on running only, not prior to that. That’s why the confusion.
Cheers.
Good post Paul
Whats the accepted CXPACKET % of total wait in OLAP/OLTP ?
Does it have to be under 50%?
There is no such number – it entirely depends on *your* workload. You could have an OLTP workload that has some queries that go in parallel.
in this video Brent Ozar talked about 50%,I wanted to hear your opinion about this
http://www.brentozar.com/archive/2013/08/what-is-the-cxpacket-wait-type-and-how-do-you-reduce-it/
As I said above, entirely depends on what your workload needs to be doing. There’s no generalized threshold that I know of that’s valid – every workload is different. You can’t performance tune your workload based on other people’s thresholds. Say you go with 50% as your threshold and you’re at 45% CXPACKET waits. Does that mean your workload is performing well? You have no idea until you investigate where the CXPACKETs are coming from and whether the parallelism is warranted.
makes sense
Thanks Paul
Paul are you still accepting wait statistics results? I have some I want you to take a look at.
Thanks!
Not for the survey, but shoot them over and I’ll see if anything looks amiss.
Thank you so much for this post! I have been bashing my head against the terrible performance of our new server and now I feel like I have a chance. WRITELOGS … I’m comming for you.
Very good article!
Is there an answer to this question: How to know the wait time due to auto_update_stats in synchronous mode?
AFAIK there isn’t a wait type for that.
Hi Paul
Are the background processes included in the “SQL Server waits” chart in the management Data Warehouse reports?
In general, would you recommend to keep them in or filter them out?
Hey Adi – I don’t know anything about what’s in the MDW reports, although I do know that it’s likely pulling from sys.dm_os_wait_stats, which doesn’t distinguish between system and user threads. There is no way to filter out background processes apart from filtering out the wait types they usually incur, which my script already does. Thanks
Thanks!
Hello Paul
We have a table where parallel data load happens. 30 concurrent sessions inserting into this table. We do have a short but randomized clustered key on this table so there is no insert hot spot problem. However the from time to time some the concurrent inserts are stuck for ever. While checking what is running/waiting, reveals all these threads are suspended with wait_type = <>. You have filtered out this wait type as this not usually a problem, but in our case the parallel inserts are stuck due to this wait type. Can you advise what can we do here? Many Thanks.
Ram.
Look for hash joins and spills to tempdb – they’re a common root cause of long SLEEP_TASK waits.
These are simple inserts with values clause, (triggered from Informatica threads). THis inserts are then paramatized (by odbc/sql simple paramatization) and inserted into tables. This are not Insert..select pattern. So not sure if Hash tables / temp db spills are invovled here. Thanks.
Then you’ll need to capture call stacks and send them to me to see where they’re occurring. See https://www.sqlskills.com/blogs/paul/determine-causes-particular-wait-type/
I’m suddenly fascinated – I’d often wondered about this.
I’ve seen some queries running where it seems like the only “likely” source of a major delay is poor TempDB performance – usually due to overloaded disks.
Now, we both know that when the only “likely” source is X, there’s almost always a Y, or Z that we haven’t thought of. (Well – that *I* haven’t thought of – you may have already! :-) )
And my best guess for how TempDB would affect this would be that very sort of thing – spills to TempDB. Because if you’re using a #TempTable, you’ll get standard waits; you might need to wait on PageIOLatch, you might have latch contention on the allocation pages, but all of these show up just like any other wait – nothing sneaky about them.
It sounds like, if I saw a bunch of SLEEP_TASK waits, piling up unexpectedly quickly at the very times that query is running slowly, that could be reason to push for TempDB improvements sooner rather than later.
Hm. Good guesses aren’t a bad idea (especially when nothing else seems to pop up) but thinking of your colleague, Mr. Kehayias, there *must* be an extended event that might tell more of the story.
Yes, that’s a reasonable assumption, but I’d want to correlate the SLEEP_TASK waits with slow queries to be sure.
Hello Paul
For some reason, the critical wait_type=SLEEP_TASK didn’t appear earlier… Hence reposting the question…
We have a table where parallel data load happens. 30 concurrent sessions inserting into this table. We do have a short but randomized clustered key on this table so there is no insert hot spot problem. However the from time to time some the concurrent inserts are stuck for ever. While checking what is running/waiting, reveals all these threads are suspended with wait_type = SLEEP_TASK. You have filtered out SLEEP_TASK wait_type as this not usually a problem, but in our case the parallel inserts are stuck due to this wait type. Can you advise what can we do here? Many Thanks
Hi, is there a way to find out which queries are causing these waits? I believe extended events works from SQL Server 2008 onwards, I need info on SQL Server 2005 also.. Thanks!
Only directly on 2008 and higher. With 2005 you can take very frequent snapshots of sys.dm_os_waiting_tasks using my script and filter for the wait types you’re interested in.
Paul,
Any thoughts on QDS_SHUTDOWN_QUEUE? It’s currently the top reported wait from one of our SQL 2014 prod instances. (I should add that it’s a new instance and that, so far, users are not complaining.) Is it also one that should be filtered out, like the two other QDS types already listed in your query? Or is it something non-trivial which calls for further investigation?
I’ve done some searching on the web for this wait type and not found much, so any thoughts you have would be most appreciated.
Dave
It’s for the Query Store in 2016 – you can filter it out.
Hi,
I have 2 Hyper-V VMs, one on which runs an application, the other runs just SQL 2012.
Both VMs are on the same host, which does not run anything else.
They use the same virtual switch in Hyper V. The switch is not shared with the host.
My application and SQL reporting runs very slow so I run this great scrip which showed me that 94% of my waits are Network I/O.
WaitType |Wait_S |Resource_S |Signal_S|WaitCount|Percentage| AvgWait_S|AvgRes_S|AvgSig_S
ASYNC_NETWORK_IO|10139642.81|10139403.56|239.25 |5933844 |93.48 | 1.7088 |1.7087 |0.0000
CXPACKET |655055.04 |643588.95 |11466.09|43194812 |6.04 | 0.0152 |0.0149 |0.0003
My NIC drivers are up to date.
How can I investigate this further to find out whether it’s an infrastrucure issue or an application issue?
If the ping time from SQL Server to the application server is less than 1.7087s, it’s the application, plain and simple.
Thanks for the prompt reply.
You have a valid point.
However, I’ve tested it with having SQL server installed on the same machine as the application and the speed issues are gone (or have reduced). I would have expected to see the same kind of delays if it’s an application issue?
Not sure whether the acknowledgment packets SQL needs to receive from the application before sending new data play a factor when SQL and the application are running on the same machine.
The application is Sage 300 ERP in case you’ve come across them before.
In that case, it’s the physical server where the application is running that’s causing the application to run slowly. Either the hardware itself is slower that the server running SQL Server, or the load on the app server is higher than the load on the SQL Server – so when the app runs on the SQL Server server, it runs quickly. It’s definitely not SQL Server – ASYNC_NETWORK_IO is purely SQL Server waiting for a response from the client.
I forgot to mentioned that the ping is below 1ms.
Just an update. I have disabled dynamic memory on both VM’s (SQL and Application) and the wait stats seem to be better now.
WaitType | Wait_S | Resource_S | Signal_S | WaitCount | Percentage | AvgWait_S | AvgRes_S| AvgSig_S
CXPACKET | 1830.80| 1810.02 | 20.78 | 110945 | 63.51 | 0.0165 | 0.0163 | 0.0002
ASYNC_NETWORK_IO| 507.91 | 507.78 | 0.12 | 2295 | 17.62 | 0.2213 | 0.2213 | 0.0001
PAGEIOLATCH_SH | 414.69 | 413.59 | 1.10 | 108207 | 14.39 | 0.0038 | 0.0038 | 0.0000
Thank you.
Thank you very much for this clarification. I used your suggestions and have setup a regular task to collect those values on each and every server.
One of my current (main) waitstats samples are the following:
WaitType|Wait_S|Resource_S|Signal_S|WaitCount|PercentageCnt|PercentageWaitTime|AvgWait_S|AvgRes_S|AvgSig_S
CXPACKET|71223.21|51474.42|19748.79|27125952|20.46|35.58|0.0026|0.0019|0.0007
PAGEIOLATCH_SH|32212.36|32111.84|100.52|5827418|4.40|16.09|0.0055|0.0055|0.0000
WRITELOG|18434.01|18018.50|415.51|4640727|3.50|9.21|0.0040|0.0039|0.0001
BACKUPIO|16986.17|16369.83|616.33|17239372|13.00|8.49|0.0010|0.0009|0.0000
PAGEIOLATCH_EX|14122.92|14101.01|21.91|2330476|1.76|7.06|0.0061|0.0061|0.0000
BACKUPBUFFER|9329.69|9016.41|313.28|9308468|7.02|4.66|0.0010|0.0010|0.0000
ASYNC_NETWORK_IO|7862.20|6897.58|964.62|9859323|7.44|3.93|0.0008|0.0007|0.0001
SOS_SCHEDULER_YIELD|7164.10|123.43|7040.67|45995133|34.69|3.58|0.0002|0.0000|0.0002
LATCH_EX|2115.18|1394.00|721.19|1732335|1.31|1.06|0.0012|0.0008|0.0004
Looking at the data and the charts I have created to visualize it, I have some trouble making any conclusions. Is everything fine?
What I wonder is: What is the main criteria to look at those at all? I mean, in the end, on each and every server the total number of all Wait counts and all wait times portions will always result in 100%… so as soon as I maybe improve one value, another or all other values will relatively get worse/higher. I wonder what really indicates a problem – having CTXPACKET making “21%” of all waits, yes, is this really a problem? Or any AVG_x_S value > 1?
Thank you very much.
Nothing there stands out as a long wait in itself, but it’s impossible to say whether that’s fine without being able to compare with your baseline. For detailed info on how to go about all of this, see my Pluralsight course on Wait Statistics, or the whitepaper on wait stats by Jonathan and Erin.
I have a server where the waits are:
WaitType Wait_S Resource_S Signal_S WaitCount Percentage AvgWait_S AvgRes_S AvgSig_S
CXPACKET 11651044.48 9373062.73 2277981.76 2843498821 92.52 0.0041 0.0033 0.0008
SOS_SCHEDULER_YIELD 353842.37 424.79 353417.58 198550288 2.81 0.0018 0.0000 0.0018
and nothing else. Two physical processors, 8 cores, 16 logical processors, 48Gb memory, Hyper-V. MAXDOP set to 8 (as per white paper). Cost Threshold For Parallelism now at 300. Statistics updated every night via Ola Hallengren script. Do I just keep increasing the cost threshold until CXPACKETS reduces?
Thanks
See http://sqlperformance.com/2015/06/sql-performance/knee-jerk-wait-statistics-cxpacket and http://sqlperformance.com/2015/08/sql-performance/more-on-cxpacket-waits-skewed-parallelism for tuning your parallelism.
Paul,
I recently encountered an issue where one query showed a wait type of EXECSYNC. The query in question was reading from a series of replicated table then inserting records into another table nothing to crazy.
Yup – that’s an expected wait type for some parallel operations.
I love the URL integration to the library!
Paul,
This is a VERY old post now, but I noticed something rather strange this morning and was wondering if you have any thoughts on it.
Each night, we restore a significantly sized database (400GB) onto a reporting system. This normally works wihtout issue. However, last night the restore seemed to get to 100% complete, and then just sit there.
Using sp_WhoIsActive, I could see the wait type SLEEP_BPOOL_FLUSH being presented, and none of the CPU or read/write figures were changing.
A brief google suggested running: DBCC SQLPERF (‘sys.dm_os_wait_stats’, CLEAR); as this had resolved somebody else with a similar issue.
So, I did this, and lo and behold, the database progressed past its permanent “RESTORING” state and went into “Recovery”…. after 20 minutes, the DB restore process was completed.
I dont understand how resetting the statistics would force the DB restoration to complete? Or is this just a coincidence?
I’d love to hear your thoughts on this as I am at a loss and dont like having a solution without fully understanding why it worked.
Regards,
Andy
Not really – it’s up-to-date and just as relevant today as when I originally posted it.
I suspect this was just coincidence, as SLEEP_BPOOL_FLUSH covers the whole checkpoint process, including scanning the (in your case very large) list of BUF structures looking for dirty pages to flush.
Hi Paul.
Only just recently realised that the code in the script possibly has a typo in it. You explain in the code that “– Maybe uncomment these four if you have mirroring issues” and “– Maybe uncomment these six if you have AG issues”.
Because the statement is a “…NOT IN…” you might want to change the wording to “– Maybe comment out these …” to allow the script to list these wait types.
Thanks again for a great script.
You’re right! Changed – thanks
Hi Paul,
Is there any issue if we are using below command in production ever 8 hrs of Interval.
DBCC SQLPERF (N’sys.dm_os_wait_stats’, CLEAR);
GO
It depends what monitoring you have going. Clearing wait stats might break your monitoring.
Actually We are monitoring every 8 hourly Wait State Details based Bossiness Load. but i just want to understand that if we run DBCC SQLPERF (N’sys.dm_os_wait_stats’, CLEAR); every 8 hourly and after that we are checking top 5 wait type …..so it can generate any issue on production??
or and kind of impact into Any other stuff.
It’s not going to cause any performance issue if you clear them, as wait statistics are only a passive thing, but as I said, it might impact your monitoring, depending on how you’re monitoring.
Ok ……Noted….!!!!
Thanks Paul
I understand that ASYNC_NETWORK_IO waits are usually either a slow client processing a resultset from sqlserver or rarely an actual network issue. Most of what I’ve read states that ASYNC_NETWORK_IO waits are not a database server issue. My question is can high ASYNC_NETWORK_IO waits cause other waits such as CXPACKET or LATCHES to go high? Can a slow client that causes high ASYNC_NETWORK_IO waits on a sqlserver also impact other clients? Thank you in advance.
Yup – only time ASYNC_NETWORK_IO is a db issue is if you’re using MARS (Multiple Active Result Sets), which is exceedingly rare. No – ASYNC_NETWORK_IO should not cause/effect other waits.
theres some syntax error in the last update (greater than, lower than in lines 91,105,107)
nevertheless, great script! thanks a lot
Thanks – c&p into the code formatting plugin messed it up – fixed!
Hi Paul,
It seems that the new version of Wait Stats has some syntax errors related to:
>
Thanks for the great script!
Cheers,
John
Thanks – c&p into the code formatting plugin messed it up – fixed!
Great job, Paul . Thank You so much . No errors found but WRITELOG contention
Thank you for weeding out the benign waits and giving us an usable waits SQL. I have built a mechanism to collect these waits periodically and do automatic deltas on the cumulative numbers for easy analysis here:
https://sqljana.wordpress.com/2018/04/05/sql-server-dynamically-calculate-delta-values-for-numeric-and-date-columns-from-dmvs-or-any-table/
Amazing job. Thanks for updating this useful query to do DBA Life easier
You now have the new parallel redo waits to worry about for AG’s.
Chris
Hi Paul,
We are seeing SOS Scheduler Yield waits on SQL server 2016 SP2 CU6 with constant CPU pressure.
WaitType Wait_S Resource_S Signal_S WaitCount Percentage AvgWait_S AvgRes_S AvgSig_S
SOS_SCHEDULER_YIELD 122580.55 228.89 122351.66 119610712 19.48 0.001 0 0.001
Created extended event session with your script : https://www.sqlskills.com/blogs/paul/sos_scheduler_yield-waits-and-the-lock_hash-spinlock/
Unable to get beyond this. Could you please assist.
Sure – send me an email and we can set up some consulting time – this isn’t something I can do through blog comments.
Hi Paul,
I suggest that you add the “PWAIT_EXTENSIBILITY_CLEANUP_TASK” wait type to the list of wait types that you filter out in the query.
How weird – it’s been in there since October 1, 2021 but wasn’t showing in the post. Deleted/added and it’s working now.
WaitType Wait_S Resource_S Signal_S WaitCount Percentage AvgWait_S AvgRes_S AvgSig_S
SOS_WORK_DISPATCHER 528083963.16 527540721.09 543242.08 272585739 52.16 1.9373 1.9353 0.0020
REDO_THREAD_PENDING_WORK 349552550.43 348434836.21 1117714.21 3272910819 34.52 0.1068 0.1065 0.0003
PARALLEL_REDO_WORKER_WAIT_WORK 117173370.95 116645499.27 527871.68 9658791417 11.57 0.0121 0.0121 0.0001 tell me it is problem or good , i am not able to understand. how to release there parrell redo thereds . some db are using mutliple parallel theres ,. how to trelease them . and give soulution
By design – not a problem.
Hey Paul – after a large migration to SQL Managed Instances (Business Critical), I was seeing the following three wait types at the top of list every time. Looks like these can be ignored. I get much more actionable results when I ignore these types:
N’PREEMPTIVE_XE_DISPATCHER’,
N’XE_LIVE_TARGET_TVF’,
N’HADR_FABRIC_CALLBACK’,