[Edit 2016: Check out my new resource – a comprehensive library of all wait types and latch classes – see here.]
Back in February I kicked off a survey asking you to run code that created a 24-hour snapshot of the most prevalent wait statistics. It’s taken me a few months to provide detailed feedback to everyone who responded and to correlate all the information together. Thanks to everyone who responded!
I did this survey because I wanted to see how the results had changed since my initial wait statistics survey back in 2010.
Check It Out!
SQLskills Complete Short Course Bundle
$4,575.00 Original price was: $4,575.00.$899.00Current price is: $899.00.
The results are interesting!
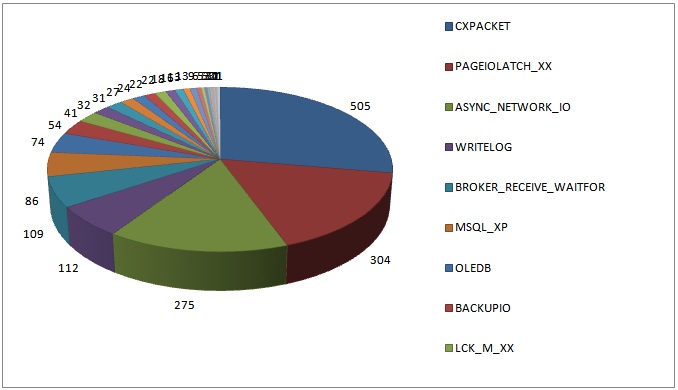
2010 Survey Results
Results from 1823 servers, top wait type since server last restarted (or waits cleared). The blog post for this survey (Wait statistics, or please tell me where it hurts) has a ton of information about what these common wait types mean, and I’m not going to repeat all that in this blog post.

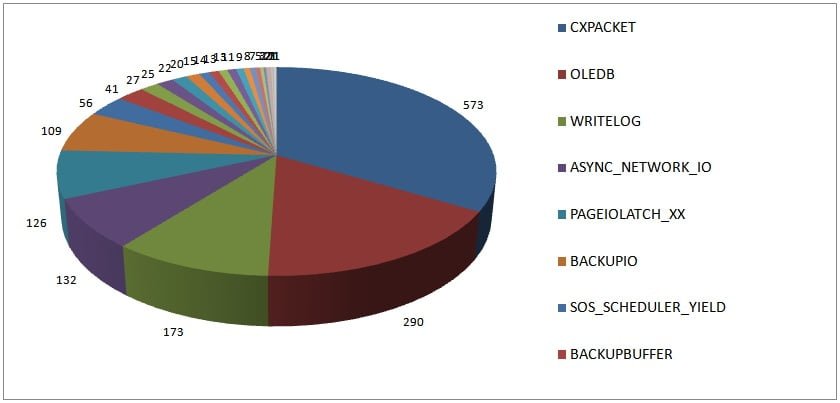
2014 Survey Results
Results from 1708 servers, top wait type over 24 hours
The distribution of the top waits has changed significantly over the last four years, even when taking into account that in the 2010 survey I didn’t filter out BROKER_RECEIVE_WAITFOR.
- CXPACKET is still the top wait type, which is unsurprising
- OLEDB has increased to being the top wait type roughly 17% of the time compared to roughly 4% in 2010
- WRITELOG has increased to being the top wait 10% of the time compared with 6% in 2010
- ASYNC_NETWORK_IO has decreased to being the top wait 8% of the time compared with 15% in 2010
- PAGEIOLATCH_XX has decreased to being the top wait 7% of the time compared with 18% in 2010
These percentages remain the same even when I ignore the BROKER_RECEIVE_WAITFOR waits in the 2010 results.
Now I’m going to speculate as to what could have caused the change in results. I have no evidence that supports most of what I’m saying below, just gut feel and supposition – you might disagree. Also, even though the people reading my blog and responding to my surveys are likely to be paying more attention to performance and performance tuning than the general population of people managing SQL Server instances across the world, I think that these results are representative of what’s happening on SQL Server instances across the world.
I think that OLEDB waits have increased in general due to more and more people using 3rd-party performance monitoring tools that make extensive, repeated use of DMVs. Most DMVs are implemented as OLE-DB rowsets and will cause many tiny OLEDB waits (1-2 milliseconds on average, or smaller). This hypothesis is actually borne out by the data I received and confirmation from many people who received my detailed analyses of results they sent me. If you see hundreds of millions or billions of tiny OLEDB waits, this is likely the cause.
I think WRITELOG waits being the top wait have increased partly because other bottlenecks have become less prevalent, and so the next highest bottleneck is the transaction log, and partly because more workloads are hitting logging bottlenecks inside SQL Server that are alleviated starting in SQL Server 2012 (blog post coming next week!). I also think that WRITELOG waits have been prevented from becoming even more prevalent because of the increased use of solid-state disks for transaction log storage mitigating the increased logging from higher workloads.
Now it could be that the drop in PAGEIOLATCH_XX and ASYNC_NETWORK_IO waits being the top wait is just an effect caused by the increase in OLEDB and WRITELOG waits. It could also be because of environmental changes…
PAGEIOLATCH_XX waits being the top wait might have decreased because of:
- Increased memory on servers meaning that buffer pools are larger and more of the workload fits in memory, so fewer read I/Os are necessary.
- Increased usage of solid-state disks meaning that individual I/Os are faster, so when I/Os do occur, the PAGEIOLATCH_XX wait time is smaller and so the aggregate wait time is smaller and it is no longer the top wait.
- More attention being paid to indexing strategies and buffer pool usage.
ASYNC_NETWORK_IO waits being the top wait might have decreased because of fewer poorly written applications, or fixes to applications that previously were poorly written. This supposition is the most tenuous of the four and I really have no evidence for this at all. I suspect it’s more likely the change is an effect of the changes in prevalence of the other wait types discussed above.
Summary
I think it’s interesting how the distribution of top waits has occurred over the last four years and I hope my speculation above rings true with many of you. I’d love to hear your thoughts on all of this in the post comments.
It’s not necessarily bad to have any particular wait type as the most prevalent one in your environment, as waits always happen, so there has to be *something* that’s the top wait on your system. What’s useful though is to trend your wait statistics over time and notice how code/workload/server/schema changes are reflected in the distribution of wait statistics.
There is lots of information about wait statistics in my Wait Statistics blog category and there’s a new whitepaper (SQL Server Performance Tuning Using Wait Statistics: A Beginners Guide) on wait statistics written by Jonathan and Erin in conjunction with Red Gate which you can download from our website here.
Enjoy!


14 thoughts on “Most common wait stats over 24 hours and changes since 2010”
Paul,
Thanks for the write-up! One follow-up question:
You made an off-hand reference to “logging bottlenecks inside SQL Server that are alleviated starting in SQL Server 2012”. Do you have any links (or keywords I can google) to read up on these improvements? Several of my 2008 R2 instances have significant WRITELOG waits. We’re upgrading this summer (probably to 2012 rather than 2014 due to some dependency issues), and so product improvements in this area are very relevant to us.
Thanks!
Aaron
Nope – blog post coming next week.
Great, thanks Paul.
My highest wait stat hasn’t changed in 15 years: BAD_DEV_CODE ;)
Interesting info, Paul – thanks.
:-)
“SYNC_NETWORK_IO waits being the top wait might have decreased because of fewer poorly written applications, or fixes to applications that previously were poorly written. This supposition is the most tenuous of the four…”
You gift for understatement is amazing :-)
:-)
Thanks again Paul for taking the time to analyze and provide feedback on these – much appreciated and insightful.
Great analysis as always Paul.
I’m surprised you didn’t suggest that the drop in ASYNC_NETWORK_IO could be explained by people implementing faster networks between DB and web servers. While many many not afford upgrading their whole network, I suspect many can afford to upgrade a critical subnet or 2.
I was tempted, but given how infrequently we see networks being the cause of ASYNC_NETWORK_IO, I didn’t think it was likely a factor.
I Paul,
I’v followed your wait-stats plural course ( as well as IE1) and was looking at one of our environments (SQL 2008 R2, 64GB RAM for SQL, HP 980 with one NUMA node allocated to this instance ) which has WriteLog wait of 20% constantly. I’ve checked sys.dm_io_virtual_file_stats as well as OS counters and SAN counters to verify if there are any disk latency, typically we are almost always under 5ms. I’ve looked at to see if we are hitting any log manager limitations (described here http://blogs.msdn.com/b/sqlcat/archive/2013/09/10/diagnosing-transaction-log-performance-issues-and-limits-of-the-log-manager.aspx)
Can you please advice if there’s anything else I can have a look. understand waits are there and it’s not always a problem, but wondering if 20% is too high?
thanks in advance
cheers
Udula
Nope – maybe not too high – depends on what your workload and I/O characteristics are. What’s the average I/O latency to the log file? Does it match the average writelog time?
Take a look at my log performance articles over on sqlperformance.com for a lot more info here.
hi
Thanks..
This server is mainly doing OLTP.
For WRITELOG, Wait_S = 1606593.48, WaitCount = 453687142, AvgWait_S = 0.0035
average I/O latency for the log files is 2.6 ms ( derived by “Select io_stall_write_ms/(1.0+num_of_writes) from sys.dm_io_virtual_file_stats(null,null) ).
we have a latency of 1ms between our DR SAN site and asynchronous replication is used for SAN.
thanks for pointing at sqlperformance.com, I’ve being looking at http://sqlperformance.com/2012/12/io-subsystem/trimming-t-log-fat and trying to get rid of some indexes that are not being used.
I shiould correct that “we have a latency of 1ms between our DR SAN site and synchronous replication is used for SAN.”