During a recent client engagement to look at the performance problems of a production SQL Server I ran into something I hoped to never see in real life. For a long time I’ve been a proponent of Extended Events in SQL Server, and I’ve really looked forward to seeing them used more and more inside of SQL Server for diagnostics data collection, especially by third party software vendors. I’ve done a lot of performance tests comparing Extended Events to SQL Trace and Extended Events generally has lower performance impact to SQL Server performance. However, I have also found and demonstrated how specific events like collecting the actual execution plan with Extended Events can severely impact a server’s performance. Any time Erin or I talk about Extended Events, whether it is at a conference or in our IEPT02 – Performance Tuning class, one of the key things we both repeat to people is that if you see an completely unexplainable drop in server performance and throughput, check for Extended Events sessions and Traces running on the server and look at what events are being collected. For Extended Events we always demo the impact of the query_post_execution_showplan event live to demonstrate why this event should not be used in production environments ever. Yesterday I was incredibly surprised to not only find the event in an Event Session on the affected server, but also to find that it came from Idera Diagnostic Manager’s Query Monitor feature.
TL;DR
If you have Diagnostic Manager 9.0 or higher, DO NOT enable the Query Monitor feature for your servers, without first disabling (uncheck) the box to Collect Query Plans (SQL Server 2008 and up only). If you have the Query Monitor feature enabled, check the properties for all SQL Server 2008+ servers and disable the Collect Query Plans (SQL Server 2008 and up only) then do a Refresh Alerts for the server, right click the server in the console and click Refresh Server, to force it to modify the event session and remove the query_post_execution_showplan event. I have already contacted Idera regarding the performance impacts of this event being used in production environments, and have provided images of CPU Usage with the default configuration and after removing execution plan collection, showing reductions of up to 20-25%. I have also been proactively working with clients I know have Diagnostic Manager installed to get their configurations changed to remove the performance impact from any server monitored by Query Monitor in their environments.
How Do I Disable this Event/Feature?
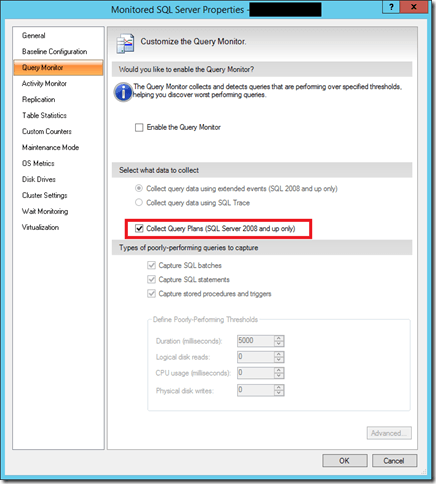
The idea behind the Query Monitor feature is to collect information about poor-performing queries based on configurable values for duration, logical_reads, CPU, or writes. This is not a bad thing and is something that most servers will want to have configured for monitoring. The problem is not with the functionality of the Query Monitor feature itself, but with just one extra event that gets added to the Extended Events session that gets created by default. To enable/disable the Query Monitor feature and change the behavior of it for an individual server, open the server’s Properties dialog from the right-click context menu in the console and click on the Query Monitor page as shown below.
Check It Out!
SQLskills Complete Short Course Bundle
$4,575.00 Original price was: $4,575.00.$899.00Current price is: $899.00.
If you simply accept the defaults for the Query Monitor feature, leaving the checkbox highlighted in red above checked, and turn it on for SQL Server 2012 or higher, an Extended Events session called SERVERNAMESQLdmQMEXevents will be created and started on your server that captures the query_post_execution_showplan event. You can examine the entire session for yourself using the Script Session As… CREATE To… New Query Editor Window option in SSMS (or equivalent DMVs in earlier versions than 2012).
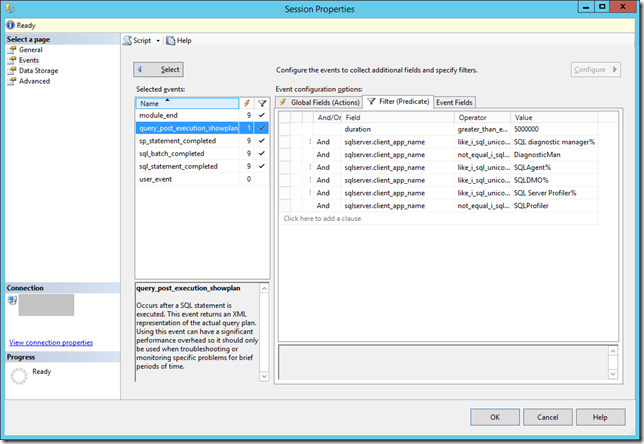
You can also use the Session Properties to see everything it’s doing (just as you can for all sessions created on your server, by any third-party tools):
Notice the highlighted event in the screenshot of the event session properties in Management Studio. This is bad! Even though the query_post_execution_showplan event has a duration filter greater than five seconds (5000000 microseconds) the performance impact of the event occurs for every single statement that gets executed inside of SQL Server because the event has to collect ALL of the default data elements, which include the showplan XML, before the predicate is evaluated. There is NO WAY to eliminate the performance overhead of this event because it collects the plan before filtering is applied. This event is one of a handful of events in Extended Events that have a warning about their performance impact in the event description:
Occurs after a SQL statement is executed. This event returns an XML representation of the actual query plan. Using this event can have a significant performance overhead so it should only be used when troubleshooting or monitoring specific problems for brief periods of time.
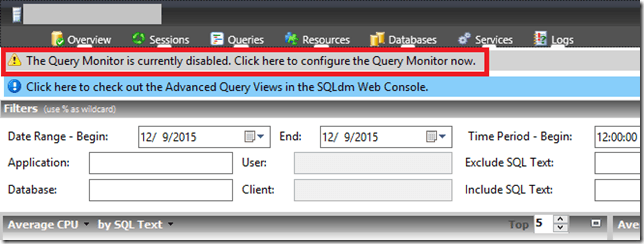
There is no warning about the performance impact anywhere in the Diagnostic Manager UI and based on the information in Idera’s online forums, Query Monitor gets enabled by default for all new instances unless you remove a checkbox on the Add Server wizard in the UI. For existing servers after an upgrade to Diagnostic Manager that were not previously using the Query Monitor feature, it remains disabled. However, when you go to the Query Details page for that server, a warning message is shown that Query Monitor is disabled, prompting you to click on it to configure the Query Monitor for the server.
Why am I writing this blog post?
The purpose of this post is to warn users of the performance impact that this feature has when the defaults are used to enable the Query Monitor against a server, and to at the same time show users how to fix the issue so that Query Monitor can be used to collect important diagnostic information without severely affecting the performance of the servers. I’ve already raised this issue with Idera separately, and I hope to see this event removed from a future update to their product entirely. The performance effects of this event outweigh the cost of having it enabled on production servers, which is why I warn anyone I talk to about Extended Events about this specific events usage in production servers. I think the usage of Extended Events by third party vendors instead of SQL Trace for this type of diagnostic data collection is a good thing overall, but I don’t believe a monitoring tool for performance should ever use an event that can severely degrade performance of a production server.
If you use Diagnostic Manager to monitor your SQL Servers, check the configuration of the Query Monitor feature on ALL SQL Server 2012+ servers and disable the execution plan collection or you WILL have performance degradation from the usage of the query_post_execution_showplan event being included in the event session monitoring your server!


12 thoughts on “A warning about Diagnostic Manager’s Query Monitor Feature in v9+”
Do you know if Idera is planning on reaching out to their clients about this?
Chris,
I have no idea whether they intend to reach out to clients about this or not. I’ve been reaching out to my clients that I know use this tool all day to get the configuration changed to fix it in their environments.
Thanks. For anyone interested, this will list all servers with Query Monitor enabled and if it’s collecting the query plan and if it’s using extended events (QueryMonitorTraceMonitoringEnabled will be 0 if it’s using extended events).
SELECT [InstanceName], [QueryMonitorCollectQueryPlan], [QueryMonitorTraceMonitoringEnabled] FROM [dbo].[MonitoredSQLServers] WHERE [QueryMonitorEnabled] = 1
Thanks a lot! You’ve saved me quite an embarrassment as I’m going to install Diagnostics Manager at client’s site on Monday. And this particular client has really busy OLTP environment which constantly runs at ~60-70% CPU. So I don’t even want to imagine what Query Monitor could have done to their main production server.
We have had the same experience on our PRODUCTION box because of this. We simply disabled this feature and contacted IDERA as well, but no response yet.
When you say “right click the server in the console and click Refresh Server” If I right click the server I don’t see this option ( I have 9.1 version)
I’m guessing Jonathan meant to say Refresh Alerts instead of Refresh Server:
“then do a Refresh Alerts for the server, right click the server in the console and click Refresh” Alerts “, to force it to modify the event session and remove the query_post_execution_showplan event.”
Thank you so much for bringing this to the public, and thank you Chris F for the SQL query.
I had reported this to Idera myself several months ago when investigating performance issues on one of my servers only to realise that the problem came from the monitoring tool itself!!
What did Idera support do after I uncovered the “sticky” extended events (instead of giving it 5min to try and replicate the problem on their test rig)? Ask for my logs… No thanks, I am not spending an hour finding/extracting/zipping/encrypting/sending my logs for a systemic issue that everyone can reproduce in 5min.
I hope that they will fix the bug now that it shows right there on sqlskills.com!
OK, there is a workaround (does it work all the time?), but when one hits “OK” or “Apply”, one would expect the software to do its job, and all of it (I mean, especially when it is only a couple of lines of code in this instance).
Then hopefully they will fix the showstopper bug that prevents installing Diagnostic Manager repository on the patched up versions of SQL Server 2012 and 2014 (because Microsoft changed the values returned by @@version). But I digress…
On your digression: Yesterday I installed SQLdm 10.1 on SQL 2012 SP3 (11.0.6020) and it installed without errors, so I think they fixed the @@version install issue for 10.1
Dears,
I have the new Idera Diagnostic manager installed, I have version 10.5, They have Solved this first by giving you the option for estimated Query plans and also writing warning above the Actual query plan saying that it cause significant performance overhead.
Out of curiosity, how much has your advice on this changed with lightweight query execution statistics profiling being added as of SQL 2014 SP2? Not specifically for Idera, but also for a stand-alone Extended Events session with a duration filter slightly below the timeout threshold.
It will still impact performance across the board for producing the showplanxml before it gets to apply the predicate. If there was a collect_showplan_xml Action in XE, that would only fire after event predicate evaluation determines the event would fully fire, that would be a useful addition, but the event has to collect all of it’s payload data before it can even evaluate the predicate to determine that it doesn’t even fire fully, and that is where the showplan events lead to performance impacts unfortunately.