At the end of May 2017, Paul and I had a discussion about SOS_SCHEDULER_YIELD waits and whether or not they could become skewed in SQL Server as a result of hypervisor scheduling issues for a VM running SQL Server. I did some initial testing of this in my VM lab using both Hyper-V and VMware and was able to create the exact scenario that Paul was asking about, which he explains in this blog post. I’ve recently been working on reproducing another VM scheduling based issue that shows up in SQL Server, where again the behaviors being observed are misleading as a result of the hypervisor being oversubscribed, only this time it was not for the SQL Server VM, it was instead for the application servers, and while I was building a repro of that in my lab, I decided to take some time and rerun the SOS_SCHEDULER_YIELD tests and write a blog post to show the findings in detail.
The test environment that I used for this is a portable lab I’ve used for demos for VM content over the last eight years teaching our Immersion Events. The ESX host has 4 cores and 8GB RAM and hosts three virtual machines, a 4vCPU SQL Server with 4GB RAM, and two 2vCPU Windows Server VM’s with 2GB RAM that are used strictly to run Geekbench to produce load. Within SQL Server, I a reproducible workload that drives parallelism and is repeatable consistently, that I have also used for years in teaching classes.
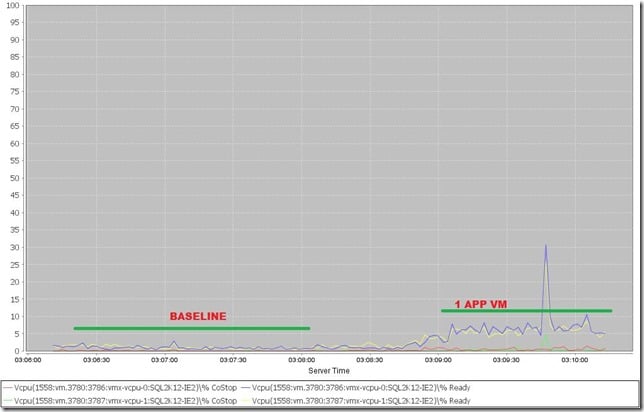
For the tests, I first ran a baseline where the SQL Server VM is the only machine executing any tasks/workload at all, but the other VMs are powered on and just sitting there on the hose. This establishes a base metric in the host and had 1% RDY time average during the workload execution, after which I collected the wait stats for SOS_SCHEDULER_YIELD.
Check It Out!
SQLskills Complete Short Course Bundle
$4,575.00 Original price was: $4,575.00.$899.00Current price is: $899.00.
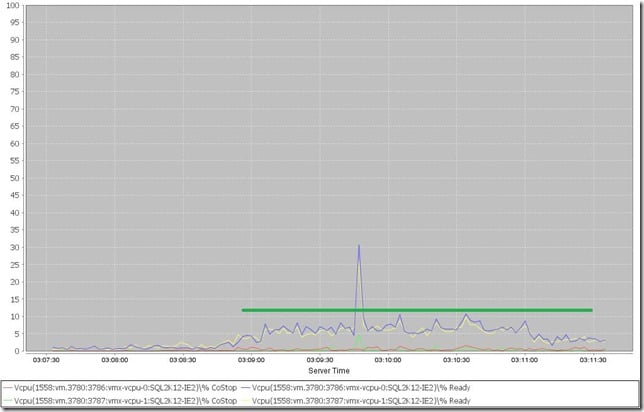
Then I reran the tests but ran four copies of GeekBench on one of the application VM’s to drive the CPU usage for that VM and keep it having to be scheduled by the hypervisor, and then reran the SQL Server workload. This put the SQL Server VM at 5% RDY time in the hypervisor during the tests, which is my low watermark for where you would expect performance issues to start showing. When the SQL workload completed, I recorded the waits again.
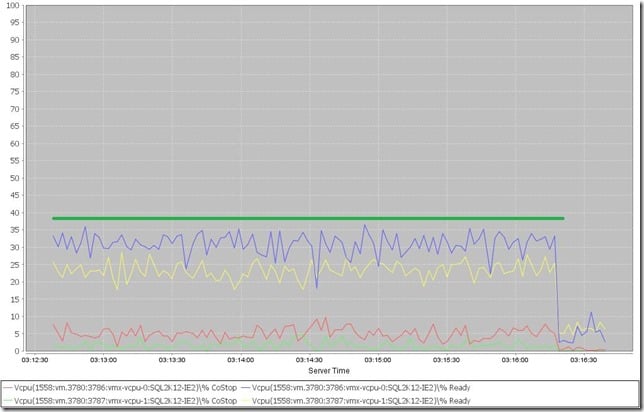
Then I repeated the test again, but with both of the application VM’s running four copies of Geekbench. The SQL Server VM had an average of 28% RDY time, and when the workload completed the waits were recorded a final time.
As you can see below there is a direct increase in the wait occurrence with the increase in RDY%.
| Test | AVG RDY% | wait_type | waiting_tasks_count | wait_time_ms | max_wait_time_ms | signal_wait_time_ms | Duration |
| 2 APP VM | 28.4 | SOS_SCHEDULER_YIELD | 10455 | 22893 | 124 | 22803 | 3:59 |
| 1 APP VM | 5.1 | SOS_SCHEDULER_YIELD | 2514 | 3618 | 62 | 3608 | 1:57 |
| Baseline | 1.2 | SOS_SCHEDULER_YIELD | 1392 | 974 | 12 | 963 | 1:32 |
High CPU Ready time is something that should be consistently monitored for with SQL Server VM’s where low latency response times are required. It also should be monitored for application VMs where latency is important as well. One thing to be aware of with any of the wait types on a virtualized SQL Server, not just the SOS_SCHEDULER_YIELD wait, is that the time spent waiting is going to also include time the VM has to wait to be scheduled by the hypervisor as well. The SOS_SCHEDULER_YIELD wait type is unique in that the number of occurrences of the wait type increases because of the time shifts that happen causing quantum expiration internally for a thread inside of SQLOS forcing it to yield, even if it actually didn’t get to make progress due to the hypervisor not scheduling the VM.


7 thoughts on “CPU Ready Impact on SOS_SCHEDULER_YIELD”
Is it possible to read RDY% guest side? That is without having access to the virtualization infrastructure
No, you would have to have vCenter access or access to the host to get that data. If you have access to the vCenter database, it is possible to query the realtime summation values for a VM (https://www.sqlskills.com/blogs/jonathan/querying-the-vmware-vcenter-database-vcdb-for-performance-and-configuration-information/) but then you need to do math based on the VM configuration to get the RDY% from the summation (https://www.sqlskills.com/blogs/jonathan/cpu-ready-time-in-vmware-and-how-to-interpret-its-real-meaning/).
Ok, does this mean that only at guest side is impossible to observe if the host is overloaded?
If it is really overloaded, you can observe it, the mouse would be jumpy, performance would be off, you would see the effects of the costops and scheduling issues happening but you couldn’t prove that was the root cause without accessing vCenter or the ESXTOP information on the host.
This is great. Last year I had a lot of problems with a cluster on a fully virtualized environment that I was 99% sure was related to it being oversubscribed but couldn’t prove it. Now I know what else to look for. In my case we had almost daily AlwaysOn fail-overs but I didn’t have enough access to the infrastructure to prove it was outside of SQL.