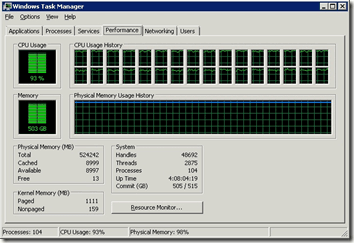
Common Table Expressions (CTEs), window functions, and views are all common things in SQL Server development these days. When CTEs and window functions were introduced in SQL Server 2005, a lot of developers jumped in and began using them to solve problems and simplify code. While these tools can be a great benefit in SQL Server, they can also be the cause of significant performance problems in certain scenarios. I recently engaged in some performance tuning with a client after a code change was deployed to their production server that resulted in CPU usage of nearly 100% across all 32 logical processors. The resulting performance problems in their application made this a critical situation for the client. The fix required a few hours rewriting a couple of the modified stored procedures to reduce the CPU usage back down to the normal range of 10-20%.
 |
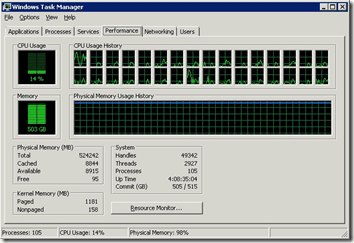 |
| CPU Usage Initially | CPU Usage After Rewrites |
The root cause of the problem was something I consider to be a coding anti-pattern, using a CTE with a window function inside of a view. As we’ll see in this post, mixing the three of these together can result in significant performance problems from the need to materialize the intermediate results of the view before filtering can be applied.
Setting up The Problem
To demonstrate the problem I’ll first create a new table in AdventureWorks2012 to show the impact on performance as the number of rows increases in our test table. This table will be based on the HumanResources.EmployeePayHistory table and can be generated with the script attached to this post.
Check It Out!
SQL Server Jumpstart+ Bundle
$4,070.00 Original price was: $4,070.00.$999.00Current price is: $999.00.
- To create the table with 316 rows, comment out the second INSERT statement entirely
- To create the table with 11,916 rows, change the GO for the second INSERT to be GO 40
- To create the table with 116,316 rows, change the GO for the second INSERT to be GO 400
- To create the table with 1,160,316, change the GO for the second INSERT to be GO 4000
With my table created, I’ll create a view to return the current pay value for the employees as follows:
CREATE VIEW dbo.EmployeeCurrentPayData
AS

WITH PayChanges AS(
SELECT
    per.BusinessEntityID,
    per.FirstName,
    per.LastName,
    per.MiddleName,
    emp.JobTitle,
    pay.Rate,
    pay.PayFrequency,
    ROW_NUMBER() OVER (PARTITION BY per.BusinessEntityID, JobTitle, PayFrequency ORDER BY pay.RateChangeDate DESC) AS RevisionID
FROM Person.Person AS per
INNER JOIN HumanResources.Employee AS emp
    ON per.BusinessEntityID = emp.BusinessEntityID
LEFT JOIN HumanResources.EmployeePayHistoryEnlarged AS pay
    ON emp.BusinessEntityID = pay.BusinessEntityID)
SELECT
    BusinessEntityID,
    FirstName,
    LastName,
    MiddleName,
    JobTitle,
    Rate,
    PayFrequency
FROM PayChanges
WHERE RevisionID = 1;

GO
Then I’ll create a stored procedure for my application to be able to get the current pay value for a specific employee by the BusinessEntityID for the employee.
CREATE PROCEDURE dbo.GetEmployeeCurrentPay_View (@BusinessEntityID INT)
AS
BEGIN

SELECT
    BusinessEntityID,
    FirstName,
    LastName,
    MiddleName,
    JobTitle,
    Rate,
    PayFrequency
FROM dbo.EmployeeCurrentPayData
WHERE BusinessEntityID = @BusinessEntityID;

END
GO
If I run the stored procedure for any employee’s BusinessEntityID the results will always be a single row.
DECLARE @BusinessEntityID INT = 250;
EXECUTE dbo.GetEmployeeCurrentPay_View @BusinessEntityID;
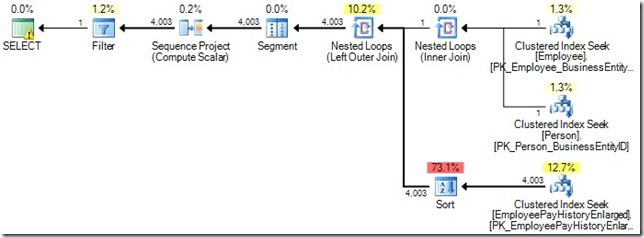
For a table with 316 rows of pay history, the execution plan will have the following shape:
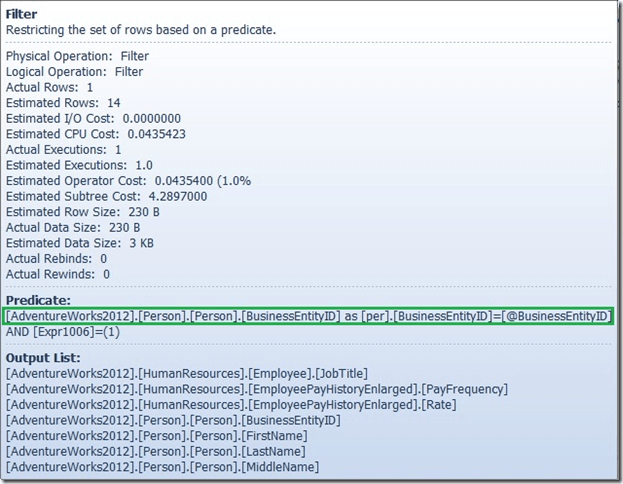
The execution plan shows that the tables were all scanned and the CTE was computed before the filter predicate on BusinessEntityID was applied. I can see this in the tool-tip for the Filter operator and by the number of input rows versus output rows for the Filter.
With a small number of rows, this doesn’t show up as being a significant problem as shown by the STATISTICS IO and STATISTICS TIME output for the execution.
SQL Server parse and compile time:
   CPU time = 14 ms, elapsed time = 14 ms.

Table 'Worktable'. Scan count 0, logical reads 0, physical reads 0, read-ahead reads 0, lob logical reads 0, lob physical reads 0, lob read-ahead reads 0.
Table 'Person'. Scan count 0, logical reads 897, physical reads 0, read-ahead reads 0, lob logical reads 0, lob physical reads 0, lob read-ahead reads 0.
Table 'Employee'. Scan count 1, logical reads 9, physical reads 0, read-ahead reads 0, lob logical reads 0, lob physical reads 0, lob read-ahead reads 0.
Table 'EmployeePayHistoryEnlarged'. Scan count 1, logical reads 4, physical reads 0, read-ahead reads 0, lob logical reads 0, lob physical reads 0, lob read-ahead reads 0.

 SQL Server Execution Times:
   CPU time = 0 ms,  elapsed time = 4 ms.
The total execution time was just 4ms with 316 rows. If I scale up our test table to 11,916 rows, the plan changes to using a Merge Join with the EmployeePayHistoryEnlarged table, but I can still see that the CTE was fully computed before the filtering on BusinessEntityID was applied.
Performance wise, the stored procedure executes in 85ms and only uses 31ms of CPU time as shown by the execution statistics.
SQL Server parse and compile time:
   CPU time = 0 ms, elapsed time = 9 ms.

Table 'EmployeePayHistoryEnlarged'. Scan count 1, logical reads 86, physical reads 0, read-ahead reads 0, lob logical reads 0, lob physical reads 0, lob read-ahead reads 0.
Table 'Person'. Scan count 0, logical reads 897, physical reads 0, read-ahead reads 0, lob logical reads 0, lob physical reads 0, lob read-ahead reads 0.
Table 'Employee'. Scan count 1, logical reads 9, physical reads 0, read-ahead reads 0, lob logical reads 0, lob physical reads 0, lob read-ahead reads 0.

 SQL Server Execution Times:
   CPU time = 31 ms,  elapsed time = 85 ms.
The real problems start to occur when the number of rows is increased to 116,316. The increased cost of computing the CTE entirely results in an execution plan that uses parallelism.
Testing this stored procedure on its own wouldn’t make you think that there was a performance problem lying in wait for a production system. Looking at the execution statistics, the procedure executed in 240ms, but the important item to look at is the shift in proportion of CPU time. Since the query used parallelism, I now have significantly more CPU time, by a factor of 3 in the 4vCPU VM I tested this on, which is the result of multiple threads processing the execution.
SQL Server parse and compile time:
   CPU time = 16 ms, elapsed time = 16 ms.

Table 'Employee'. Scan count 25, logical reads 22, physical reads 0, read-ahead reads 0, lob logical reads 0, lob physical reads 0, lob read-ahead reads 0.
Table 'Person'. Scan count 25, logical reads 319, physical reads 0, read-ahead reads 0, lob logical reads 0, lob physical reads 0, lob read-ahead reads 0.
Table 'EmployeePayHistoryEnlarged'. Scan count 25, logical reads 949, physical reads 0, read-ahead reads 0, lob logical reads 0, lob physical reads 0, lob read-ahead reads 0.
Table 'Worktable'. Scan count 0, logical reads 0, physical reads 0, read-ahead reads 0, lob logical reads 0, lob physical reads 0, lob read-ahead reads 0.

 SQL Server Execution Times:
   CPU time = 643 ms,  elapsed time = 240 ms.
The problem with this specific procedure is that it doesn’t just get executed once, it gets executed thousands of times every couple of seconds, so the cumulative effect of the CPU time required to compute the CTE completely becomes significant enough to run a 32-core server at nearly 100% CPU utilization as shown in the images at the top of the post.
The problem only gets worse as the number of rows in the table increases, as shown by the execution plan and execution statistics for 1,160,316 rows.
Note: Depending on the hardware that the tests are run on, the plan might be different for these tests. For example the first plan below was generated with 4 vCPUs while the second plan using the Hash Join and Bitmap optimization was generated on the same server but with the -Pn startup parameter to start SQLOS with 24 logical schedulers, as showed in my post SQL Server and Soft NUMA. In either case parallelism is used and the CPU time is roughly three times the execution time.
SQL Server parse and compile time:
   CPU time = 0 ms, elapsed time = 0 ms.

Table 'EmployeePayHistoryEnlarged'. Scan count 290, logical reads 7416, physical reads 0, read-ahead reads 0, lob logical reads 0, lob physical reads 0, lob read-ahead reads 0.
Table 'Person'. Scan count 0, logical reads 923, physical reads 0, read-ahead reads 0, lob logical reads 0, lob physical reads 0, lob read-ahead reads 0.
Table 'Employee'. Scan count 5, logical reads 22, physical reads 0, read-ahead reads 0, lob logical reads 0, lob physical reads 0, lob read-ahead reads 0.
Table 'Worktable'. Scan count 0, logical reads 0, physical reads 0, read-ahead reads 0, lob logical reads 0, lob physical reads 0, lob read-ahead reads 0.

 SQL Server Execution Times:
   CPU time = 4336 ms,  elapsed time = 1788 ms.
SQL Server parse and compile time:
   CPU time = 23 ms, elapsed time = 23 ms.

Table 'Employee'. Scan count 25, logical reads 22, physical reads 0, read-ahead reads 0, lob logical reads 0, lob physical reads 0, lob read-ahead reads 0.
Table 'Person'. Scan count 25, logical reads 319, physical reads 0, read-ahead reads 0, lob logical reads 0, lob physical reads 0, lob read-ahead reads 0.
Table 'EmployeePayHistoryEnlarged'. Scan count 290, logical reads 7656, physical reads 0, read-ahead reads 0, lob logical reads 0, lob physical reads 0, lob read-ahead reads 0.
Table 'Worktable'. Scan count 0, logical reads 0, physical reads 0, read-ahead reads 0, lob logical reads 0, lob physical reads 0, lob read-ahead reads 0.
Table 'Worktable'. Scan count 0, logical reads 0, physical reads 0, read-ahead reads 0, lob logical reads 0, lob physical reads 0, lob read-ahead reads 0.

 SQL Server Execution Times:
   CPU time = 6209 ms,  elapsed time = 2235 ms.
How do you fix this?
Fixing this problem is actually very simple; don’t use the VIEW and move the WHERE clause for the BusinessEntityID column up into the CTE so that it can be used to filter the tables before computation occurs.
CREATE PROCEDURE dbo.GetEmployeeCurrentPay_NoView (@BusinessEntityID INT)
AS
BEGIN

WITH PayChanges AS(
SELECT
    per.BusinessEntityID,
    per.FirstName,
    per.LastName,
    per.MiddleName,
    emp.JobTitle,
    pay.Rate,
    pay.PayFrequency,
    ROW_NUMBER() OVER (PARTITION BY per.BusinessEntityID, JobTitle, PayFrequency ORDER BY pay.RateChangeDate DESC) AS RevisionID
FROM Person.Person AS per
INNER JOIN HumanResources.Employee AS emp
    ON per.BusinessEntityID = emp.BusinessEntityID
LEFT JOIN HumanResources.EmployeePayHistoryEnlarged AS pay
    ON emp.BusinessEntityID = pay.BusinessEntityID
WHERE per.BusinessEntityID = @BusinessEntityID)
SELECT
    BusinessEntityID,
    FirstName,
    LastName,
    MiddleName,
    JobTitle,
    Rate,
    PayFrequency
FROM PayChanges
WHERE RevisionID = 1;

END
GO
By pushing the WHERE clause up into the CTE, with 316 rows we get an execution plan that shows only a couple of rows are being returned from the tables during execution.
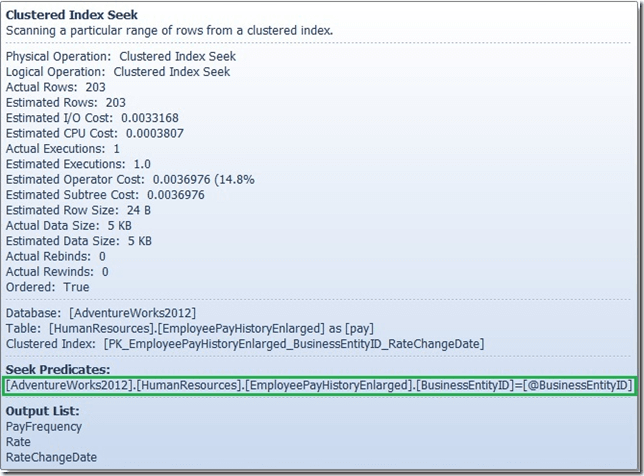
If I look at the tool-tip for the Clustered Index Seek on the EmployeePayHistoryEnlarged table, I’ll see the Seek Predicate being applied to the BusinessEnityID column to filter the results.
The execution statistics for the rewritten procedure also shows the reduction in logical reads and the execution time.
SQL Server parse and compile time:
   CPU time = 4 ms, elapsed time = 4 ms.

Table 'EmployeePayHistoryEnlarged'. Scan count 1, logical reads 2, physical reads 0, read-ahead reads 0, lob logical reads 0, lob physical reads 0, lob read-ahead reads 0.
Table 'Person'. Scan count 0, logical reads 3, physical reads 0, read-ahead reads 0, lob logical reads 0, lob physical reads 0, lob read-ahead reads 0.
Table 'Employee'. Scan count 0, logical reads 2, physical reads 0, read-ahead reads 0, lob logical reads 0, lob physical reads 0, lob read-ahead reads 0.

 SQL Server Execution Times:
   CPU time = 0 ms,  elapsed time = 4 ms.
I also get plan stability with this rewrite, regardless of the number of rows I have in our EmployeePayHistoryEnlarged table. At 1,160,316 rows, the execution plan is still the same, except that I can see more rows being returned from EmployeePayHistoryEnlarged to be able to identify the most recent pay rate.
The execution statistics also shows the reduction in logical reads, and the lower CPU time and execution time for the procedure.
SQL Server parse and compile time:
   CPU time = 0 ms, elapsed time = 0 ms.

Table 'EmployeePayHistoryEnlarged'. Scan count 1, logical reads 25, physical reads 0, read-ahead reads 0, lob logical reads 0, lob physical reads 0, lob read-ahead reads 0.
Table 'Person'. Scan count 0, logical reads 3, physical reads 0, read-ahead reads 0, lob logical reads 0, lob physical reads 0, lob read-ahead reads 0.
Table 'Employee'. Scan count 0, logical reads 2, physical reads 0, read-ahead reads 0, lob logical reads 0, lob physical reads 0, lob read-ahead reads 0.

 SQL Server Execution Times:
   CPU time = 16 ms,  elapsed time = 152 ms.
What was Actually the Problem?
Since I have three different coding aspects at play here, you are probably wondering what exactly was the root problem? If you aren’t wondering that, you aren’t alone, I didn’t either, but after doing a review of the article, my colleague Joe Sack pointed out that it was unclear where the problem actually was. I have to agree with Joe; so far I haven’t really shown definitively where the problem is. Is it the fact that I have a CTE within a view? Let’s find out. First I’ll rewrite a new view that only contains a CTE, but still provides the same result as the original test query, using a sub-query to determine the MAX(RateChangeDate) from the EmployeePayHistoryEnlarged table for the BusinessEntityID and PayFrequency.
/* Drop the view before creating it */
IF OBJECT_ID(N'EmployeeCurrentPayData_NoWF') IS NOT NULL
BEGIN
    DROP VIEW dbo.EmployeeCurrentPayData_NoWF;
END
GO

/* Create the problem view for the tests */
CREATE VIEW dbo.EmployeeCurrentPayData_NoWF
AS
WITH PayChanges AS(
SELECT
    per.BusinessEntityID,
    per.FirstName,
    per.LastName,
    per.MiddleName,
    emp.JobTitle,
    pay.Rate,
    pay.PayFrequency
FROM Person.Person AS per
INNER JOIN HumanResources.Employee AS emp
    ON per.BusinessEntityID = emp.BusinessEntityID
LEFT JOIN HumanResources.EmployeePayHistoryEnlarged AS pay
    ON emp.BusinessEntityID = pay.BusinessEntityID
WHERE RateChangeDate = (SELECT MAX(RateChangeDate)
                        FROM HumanResources.EmployeePayHistoryEnlarged AS pay2
                        WHERE pay.BusinessEntityID = pay2.BusinessEntityID
                          AND pay.PayFrequency = pay.PayFrequency)
)
SELECT
    BusinessEntityID,
    FirstName,
    LastName,
    MiddleName,
    JobTitle,
    Rate,
    PayFrequency
FROM PayChanges;
GO

/* Drop the stored procedure using the view before creating it */
IF OBJECT_ID(N'GetEmployeeCurrentPay_ViewNoWF') IS NOT NULL
BEGIN
    DROP PROCEDURE dbo.GetEmployeeCurrentPay_ViewNoWF;
END
GO

/* Create the stored procedure that uses the view to tes the problem */
CREATE PROCEDURE dbo.GetEmployeeCurrentPay_ViewNoWF (@BusinessEntityID INT)
AS
BEGIN
    SELECT
BusinessEntityID,
    FirstName,
    LastName,
    MiddleName,
    JobTitle,
    Rate,
    PayFrequency
    FROM dbo.EmployeeCurrentPayData_NoWF
    WHERE BusinessEntityID = @BusinessEntityID;
END
GO
Now a simple test by running the new procedure and reviewing the execution plan for 1,160,316 rows:
SQL Server parse and compile time:
   CPU time = 12 ms, elapsed time = 12 ms.

Table 'Employee'. Scan count 0, logical reads 2, physical reads 0, read-ahead reads 0, lob logical reads 0, lob physical reads 0, lob read-ahead reads 0.
Table 'EmployeePayHistoryEnlarged'. Scan count 1, logical reads 6, physical reads 0, read-ahead reads 0, lob logical reads 0, lob physical reads 0, lob read-ahead reads 0.
Table 'Person'. Scan count 0, logical reads 3, physical reads 0, read-ahead reads 0, lob logical reads 0, lob physical reads 0, lob read-ahead reads 0.

 SQL Server Execution Times:
   CPU time = 0 ms,  elapsed time = 102 ms.
I think it is pretty apparent that using a CTE in a view isn’t the problem. Since I now know that the issue isn’t the CTE within the view, how about the window function inside of the CTE? To test this, I can take the view definition, add a filter to the query against the CTE for the BusinessEntityID, and look at the resulting plan and performance:
DECLARE @BusinessEntityID INT = 250;

WITH PayChanges AS(
SELECT
    per.BusinessEntityID,
    per.FirstName,
    per.LastName,
    per.MiddleName,
    emp.JobTitle,
    pay.Rate,
    pay.PayFrequency,
    ROW_NUMBER() OVER (PARTITION BY per.BusinessEntityID, JobTitle, PayFrequency ORDER BY pay.RateChangeDate DESC) AS RevisionID
FROM Person.Person AS per
INNER JOIN HumanResources.Employee AS emp
    ON per.BusinessEntityID = emp.BusinessEntityID
LEFT JOIN HumanResources.EmployeePayHistoryEnlarged AS pay
    ON emp.BusinessEntityID = pay.BusinessEntityID)
SELECT
    BusinessEntityID,
    FirstName,
    LastName,
    MiddleName,
    JobTitle,
    Rate,
    PayFrequency
FROM PayChanges
WHERE RevisionID = 1
  AND BusinessEntityID = @BusinessEntityID;
Since I have the same plan for 1,160,316 rows as my original problem, it’s clear that the issue is the fact that the CTE has to compute the entire result set before it can filter on the BusinessEntityID. So knowing this, why would I even mention views in this post? It’s quite simple, the reason I generally see problems like this occur is that the developer/DBA wanted to simplify the code across multiple objects rather than have the same CTE fully expanded in each of the objects that needed to access the data in this manner. This is the same reason that user defined functions get used as much as they do despite being slower than set-based solutions that require more code in each of the objects that would have used the function for simplicity.
I could test a window function inside a view, but I’ve already shown above that the problem is actually related to the window function inside of the CTE and where the predicate evaluation actually is being applied.
Summary
While using a CTE inside of a view isn’t the actual performance problem, and instead the window function inside of the CTE with filtering after computation is the cause of the performance issue. The desire to use a view to simplify code typically leads to the coding practice which results in the performance problem occurring. By changing the coding pattern to remove the view, and then pushing the WHERE clause up into the CTE definition, only the rows required will be read and computed, reducing the I/O strain on the server, CPU usage, and providing a much more scalability to your code.
This is the first in a series of examples I’ll be blogging about showing some of the problems I come across while solving performance issues for our clients.






19 thoughts on “Common Table Expressions (CTEs), Window Functions, and Views”
This was a very interesting read with a clearly explained analysis. Thanks for sharing.
I’m now left wondering if I need to do a double take on some potentially ticking time bomb code that could be out there 🙂
I too see these coding design patterns often, particularly UDFs, from well intentioned developers endeavouring to produce more robust/reusable code. It’s almost counter intuitive having to educate developers that in order to produce optimal T-SQL, they sometimes need to let go of the “everyday” programming best practices that have become second nature to them to implement.
Looking forward to reading more in the series.
Very interesting. It seems to me that you can avoid the performance problem, and still manage code-simplification/re-use by using an inline-VTF rather than a view, like so:
CREATE FUNCTION dbo.EmployeeCurrentPayData(@BusinessEntityId int)
RETURNS TABLE
AS
RETURN
(
WITH PayChanges AS(
SELECT
per.BusinessEntityID,
per.FirstName,
per.LastName,
per.MiddleName,
emp.JobTitle,
pay.Rate,
pay.PayFrequency,
ROW_NUMBER() OVER (PARTITION BY per.BusinessEntityID, JobTitle, PayFrequency ORDER BY pay.RateChangeDate DESC) AS RevisionID
FROM Person.Person AS per
INNER JOIN HumanResources.Employee AS emp
ON per.BusinessEntityID = emp.BusinessEntityID
LEFT JOIN HumanResources.EmployeePayHistory AS pay
ON emp.BusinessEntityID = pay.BusinessEntityID
WHERE per.BusinessEntityID = @BusinessEntityId
)
SELECT
BusinessEntityID,
FirstName,
LastName,
MiddleName,
JobTitle,
Rate,
PayFrequency
FROM PayChanges
WHERE RevisionID = 1
)
GO
CREATE PROCEDURE dbo.GetEmployeeCurrentPay_View (@BusinessEntityID INT)
AS
BEGIN
SELECT
BusinessEntityID,
FirstName,
LastName,
MiddleName,
JobTitle,
Rate,
PayFrequency
FROM dbo.EmployeeCurrentPayData(@BusinessEntityID)
END
GO
or is there a potential problem with this approach as well?
Hey Antony,
I didn’t consider the inline TVF, but you are correct, it does solve both problems. The plan is exactly the same as the NoView procedure, and you can reuse the code as long as you are filtering the result only on the BusinessEntityID as in the example. However, if the original view was intended to have filtering on other columns in the output, you’d need to break that up into different TVFs to push the filter up in the CTE. Thanks for pointing out the TVF, I like that solution as well and I’ll add an edit above showing the plan and execution statistics with attribution to your comment.
Cheers!
Maybe just me being blind but I don’t see any link to “the script attached to this post” to create and populate HumanResources.EmployeePayHistoryEnlarged?
I don’t see that this is inherently a coding anti-pattern though. In principle SQL Server ought to be able to push the predicate down much further as it is on the leading column of the PARTITION by clause.
A connect item for a similar issue is here http://connect.microsoft.com/SQLServer/feedback/details/727419/plan-regression-with-sequence-projections
Hey Martin,
The attachement wasn’t linked correctly, that has been fixed above. There are plenty of things that we could debate that SQL Server should be able to do better, but since it doesn’t this would fit my definition of an anti-pattern for writing code to get the best performance out of what SQL Server actually does today. User defined function performance has plenty of connect items that date back to SQL Server 2000 and we’ve gotten very little in changes that improve performance there, so it continues to be an anti-pattern for performance to use UDFs.
not to further derail this thread, but…
do you consider the use of any UDF whatsoever to be an anti-pattern? Specifically, I’m thinking of scalar UDFs that don’t touch data and have no conditional logic but only encapsulate what would otherwise be otherwise be several t-sql statements (string formatting/manipulation being a classic use case).
a basic (non real-world) example:
CREATE FUNCTION dbo.trimlower (@input AS VARCHAR(80)) RETURNS VARCHAR(80) AS BEGIN
RETURN LTRIM(RTRIM(LOWER(@input)))
END
Hey Mike,
I would suggest that you read Hugo’s blog post on this topic from last year:
T-SQL User-Defined Functions: the good, the bad, and the ugly (part 1)
He does a really good job of showing that it can definitely impact performance depending on how you use the UDF and the size of the dataset it affects.
Yes see what you mean.
Similar predicate pushing issues existed in 2005 (http://jahaines.blogspot.co.uk/2010/03/performance-tuning-101-what-you-will_17.html). Shame they still seem to persist somewhat in 2012.
I’m not sure why but the issue seems to disappear if the stored procedure is altered as follows.
ALTER PROCEDURE dbo.GetEmployeeCurrentPay_View (@BusinessEntityID INT)
AS
BEGIN
SELECT *
FROM dbo.EmployeeCurrentPayData
WHERE BusinessEntityID = @BusinessEntityID
OPTION (RECOMPILE);
END
Hey Martin,
Using statement level hints, specifically OPTION(RECOMPILE), is something I only look at as a last resort where no other method of solving the problem exists. For a procedure like this one that executes thousands of times every few seconds the recompilations will affect performance and since there is a solution that doesn’t incur that overhead, it makes more sense to rewrite the code to eliminate the problem completely.
Very interesting!
It appears SQL Server often needs us to simplify things, as it gets lost in its own features.
all these years writing T-SQL and i never knew that GO could take an argument.
Do the CTE and/or View really cause the problem? It seems that the query structure and nesting cause it, not the CTE/View. AFAIK, both are just inlined at compilation time and have no effect on compilation result whatsoever.
Hey Tobi,
Did you read the blog post before commenting? There is an entire section that shows the issue isn’t the view but the windowing function having to compute inside the CTE fully to filter. It’s all covered in the post already.
Clear, concise post. Looking beyond the specific issue and solution, being walked through your troubleshooting and resolution process is an education in itself. Nicely done as usual Jonathan.
This post couldn’t have been more timely! I am in the process of rewriting a whole bunch of procedures that use this exact combination of coding patterns (view with cte and window functions). Thanks for giving me more ammunition to go back to the original development group with!
nice article, I do have one question. you mentioned that as shown below that it gets executed thousands of times. did you find this info in tool tip or from DMV?
Sharing that info is greatly appreciated.
Thanks
Jay
“The problem with this specific procedure is that it doesn’t just get executed once, it gets executed thousands of times every couple of seconds, so the cumulative effect of the CPU time required to compute the CTE completely becomes significant enough to run a 32-core server at nearly 100% CPU utilization as shown in the images at the top of the post.”
Hey Jay,
I knew the workload patterns for this specific database and application from talking to the client about how the procedures were used, but you could see the execution information in the sys.dm_exec_procedure_stats or sys.dm_exec_query_stats DMVs as long as it wasn’t compiling/recompiling or being evicted from the plan cache.
Just a note: In my observation, this happens only when the query is join with other tables. when the row_function is used with one table it always filters the records before it compute the sequence.