SQL Server 2008 R2 Service Pack 1 provides a new set of Events in Extended Events to collect performance counter data from the Windows OS that would be really useful to monitoring SQL Server. The first place I can find that they were mentioned is on a blog post by Mark Weber, a PFE for SQL and SAP at Microsoft. However, a few weeks ago a question was asked about these counters one of the forums and the question was around how to use them. I looked at the Events and found out that they aren’t really useable in their current implementation, something that is disappointing since being able to collect the data provided by these Events would really benefit most DBA’s out there.
If you look at the Events and columns, these events collect information about the Logical Disk, Processor, Process for the SQL instance, and System at 15 second intervals and makes the data available through Extended Events.
SELECT name, description
FROM  sys.dm_xe_objects
WHERE name like 'perfobject_%'
|
name Check It Out!SQLskills Complete Short Course Bundle
|
description |
|
perfobject_process |
Returns a set of counters associated with the Process performance object. The event occurs once every 15 seconds for both the SQL Server and SQL Agent processes. |
|
perfobject_system |
Returns a set of counters associated with the System performance object. The event occurs once every 15 seconds. |
|
perfobject_logicaldisk |
Returns a set of counters associated with the Logical Disk performance object. The event occurs once every 15 seconds for each hard or fixed disk drive. |
|
perfobject_processor |
Returns a set of counters associated with the Processor performance object. The event occurs once every 15 seconds for each processor in the system. |
If we look at the columns, we’ll see that the columns actually represent the individual counters under the categories exposed by the Event names. For example, the perfobject_logicaldisk event returns the following columns:
SELECT
    object_name,
    name AS column_name,
    description
FROM  sys.dm_xe_object_columns
WHERE object_name = 'perfobject_logicaldisk'
  AND column_type = 'data'
ORDER BY object_name, name
|
object_name |
column_name |
description |
|
perfobject_logicaldisk |
average_disk_bytes_per_read |
Shows the average number of bytes transferred from the disk during read operations. |
|
perfobject_logicaldisk |
average_disk_bytes_per_transfer |
Shows the average number of bytes transferred to or from the disk during write or read operations. |
|
perfobject_logicaldisk |
average_disk_bytes_per_write |
Shows the average number of bytes transferred to the disk during write operations. |
|
perfobject_logicaldisk |
average_disk_queue_length |
Shows the average number of both read and write requests that were queued for the selected disk during the sample interval. |
|
perfobject_logicaldisk |
average_disk_read_queue_length |
Shows the average number of read requests that were queued for the selected disk during the sample interval. |
|
perfobject_logicaldisk |
average_disk_seconds_per_read |
Shows the average time, in seconds, of a read operation from the disk. |
|
perfobject_logicaldisk |
average_disk_seconds_per_transfer |
Shows the time, in seconds, of the average disk transfer. |
|
perfobject_logicaldisk |
average_disk_seconds_per_write |
Shows the average time, in seconds, of a write operation to the disk. |
|
perfobject_logicaldisk |
average_disk_write_queue_length |
Shows the average number of write requests that were queued for the selected disk during the sample interval. |
|
perfobject_logicaldisk |
current_disk_queue_length |
Shows the number of requests outstanding on the disk at the time that the performance data is collected. |
|
perfobject_logicaldisk |
disk_bytes_per_second |
Shows the rate at which bytes are transferred to or from the disk during write or read operations. |
|
perfobject_logicaldisk |
disk_read_bytes_per_second |
Shows the rate at which bytes are transferred from the disk during read operations. |
|
perfobject_logicaldisk |
disk_reads_per_second |
Shows the rate at which read operations are performed on the disk. |
|
perfobject_logicaldisk |
disk_transfers_per_second |
Shows the rate at which read and write operations are performed on the disk. |
|
perfobject_logicaldisk |
disk_write_bytes_per_second |
Shows the rate at which bytes are transferred to the disk during write operations. |
|
perfobject_logicaldisk |
disk_writes_per_second |
Shows the rate at which write operations are performed on the disk. |
|
perfobject_logicaldisk |
free_megabytes |
Shows the unallocated space, in megabytes, on the disk drive. One megabyte is equal to 1,048,576 bytes. |
|
perfobject_logicaldisk |
instance_name |
The logical disk drive name |
|
perfobject_logicaldisk |
percent_disk_read_time |
Shows the percentage of time that the selected disk drive is busy servicing read or write requests. |
|
perfobject_logicaldisk |
percent_disk_time |
Shows the percentage of time that the selected disk drive is busy servicing read requests. |
|
perfobject_logicaldisk |
percent_disk_write_time |
Shows the percentage of time that the selected disk drive is busy servicing write requests. |
|
perfobject_logicaldisk |
percent_free_space |
Shows the percentage of the total usable space on the selected logical disk drive that is free. |
|
perfobject_logicaldisk |
percent_idle_time |
The percentage of time during the sample interval that the disk was idle. |
|
perfobject_logicaldisk |
split_io_per_second |
The rate at which I/Os to the disk were split into multiple I/Os. |
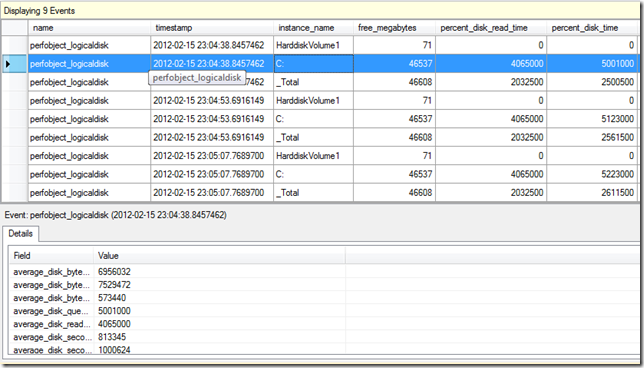
This all seems good, until we actually use the Events in an Event Session and take a look at the data being returned.
CREATE EVENT SESSION [XE_PerfCounters]
ON SERVER
ADD EVENT sqlserver.perfobject_logicaldisk
ADD TARGET package0.ring_buffer;
GO
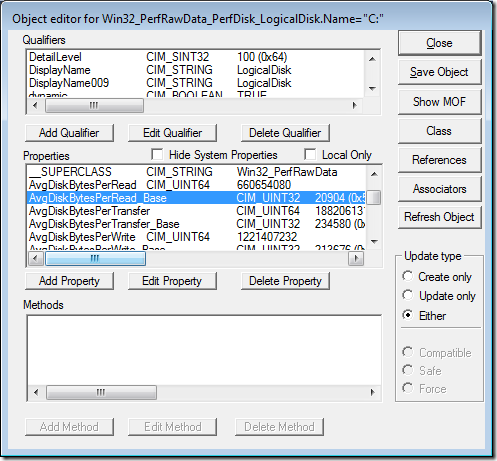
Unfortunately, the counters are returning Raw values for the Event and the necessary Base counters that are required to give these values any useful meaning have been left out of the Events data. Looking at this in my test environment, it appears the counter values pulled for the perfobject_ Events are pulled directly from Win32_PerfRawData_PerfDisk_LogicalDisk, but if you look at the CookingType requirements for the counters in Win32_PerfFormattedData_PerfDisk_LogicalDisk the raw values have to be calculated by their base values for them to have meaning:
I’ve submitted Connect Item 725167 for this and I really hope that this one gets fixed in a future Cumulative Update or Service Pack.


4 thoughts on “Extended Events PerfObject Events”
Hmm… I think the way the value is cooked for "per second" counters is to do a (delta raw)/(delta seconds). So, in order to return cooked values here, your event session would have to know how much time elapsed between the last collection and this one as well as the raw values at each point. I think that this is something that you can calculate yourself but would be difficult for extended events to do in a reliable way.
Hey Ben,
Doing the delta calculations for per second isn’t the problem here, that is easy to manage since the counters fire every 15 seconds. The problem is you don’t have the Raw Base counters don’t exist to allow calculation of the other values correctly.
Hi Jonathan,
Is there any updates on adding the base value to the extended events? Otherwise, these performance counter related events do not seem to be helpful. Especially there is NO DMV really provide any value related to the disk performance (disk sec per r/w, disk queue length, disk time pct), it will be great to have this XE work. Appreciate.
Nope, Microsoft closed the Connect item as “Won’t Fix”