Last time I posted about SSDs I presented the findings from sequential inserts with a variety of configurations and basically concluded that SSDs do not provide a substantial gain over SCSI storage (that is not overloaded) – see this blog post for more details.
You can see my benchmarking hardware setup here, with the addition of the Fusion-io ioDrive Duo 640GB drives that Fusion-io were nice enough to lend me. (For the next set of benchmarks I've just upgraded to 16GB of memory and added the second 640GB Fusion-io Duo, for a total of 1.2TB… watch this space!).
In this set of tests I wanted to see how the SSDs behaved for random reads and writes. To do this my test harness does the following:
- Formats the SSDs in one of three ways:
- Fusion-io basic format (each 320GB drive has 300GB capacity)
- Fusion-io improved write performance format (each 320GB drive has only 210GB capacity, 70% of normal)
- Fusion-io maximum write performance format (each 320GB drive has only 151GB capacity, 50% of normal)
- The SSD format is performed using Fusion-io's ioManager tool, with their latest publicly-released driver (1.2.7.1).
- Creates 1, 2, 4, 8, or 16 data files, with the file sizes calculated to fill the SSDs
- My table structure is:
CREATE TABLE MyBigTable (
c1 UNIQUEIDENTIFIER ROWGUIDCOL DEFAULT NEWID (),
c2 DATETIME DEFAULT GETDATE (),
c3 CHAR (111) DEFAULT 'a',
c4 INT DEFAULT 1,
c5 INT DEFAULT 2,
c6 BIGINT DEFAULT 42);
GOCREATE CLUSTERED INDEX MyBigTable_cl ON MyBigTable (c1);
GO
-
I have 16 connections each inserting 2 million records into the table (with the loop code running server-side)
Now before anyone complains, yes, this is a clustered index on a random GUID. It's the easiest way to generate random reads and writes, and is a very common design pattern out in the field (even though it performs poorly) – for my purposes it's perfect.
I tested each of the five data file layouts on the following configurations (all using 1MB partition offsets, 64k NTFS allocation unit size, 128k RAID stripe size – where applicable):
- Data round-robin between two RAID-10 SCSI (each with 4 x 300GB 15k and one server NIC), log on RAID-10 SATA (8 x 1TB 7.2k)
-
Data on two 320GB SSDs in RAID-0 (each of the 3 ways of formatting), log on RAID-10 SATA (8 x 1TB 7.2k)
-
Log and data on two 320GB SSDs in RAID-0 (each of the 3 ways of formatting)
-
Log and data on two 320GB SSDs in RAID-1 (each of the 3 ways of formatting)
-
Log and data on single 320GB SSD (each of the 3 ways of formatting)
-
Log and data on separate 320GB SSDs (each of the 3 ways of formatting)
-
Log and data round-robin between two 320GB SSDs (each of the 3 ways of formatting)
That's a total of 19 configurations, with 5 data file layouts in each configuration – making 95 separate configurations. I ran each test 5 times and then took an average of the results – so altogether I ran 475 tests, for a cumulative test time of just less than 250 thousand seconds (2.9 days) at the end of July.
The test harness takes care of all of this except reformatting the drives, and also captures the wait stats for each test, making note of the most prevalent waits that make up the top 95% of all waits during the test. The wait stats will be presented in the following format:
WaitType Wait_S Resource_S Signal_S WaitCount Percentage
—————————— ————– ————– ————– ———– ———-
PAGEIOLATCH_EX 26833.45 26822.85 10.60 867558 75.88
WRITELOG 7097.77 6647.26 450.51 3221475 20.0
The columns are:
- WaitType – kind of obvious
- Wait_S – cumulative wait time in seconds, from a thread being RUNNING, going through SUSPENDED, back to RUNNABLE and then RUNNING again
- Resource_S – cumulative wait time in seconds while a thread was SUSPENDED (called the resource wait time)
- Signal_S – cumulative wait time in seconds while a thread was RUNNABLE (i.e. after being signalled that the resource wait has ended and waiting on the runnable queue to get the CPU again – called the signal wait time)
- WaitCount – number of waits of this type during the test
- Percentage – percentage of all waits during the test that had this type
On to the results…
Data on SCSI RAID-10, log on SATA RAID-10
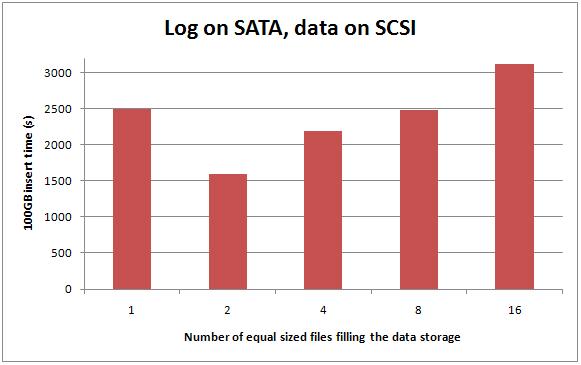
Once again this shows what I've shown a few times before – on SCSI having multiple data files on the two RAID arrays gives a performance boost. The two-file case is going from a single RAID array to two RAID arrays – bound to get a performance gain – and it gets a 35% performance boost – 6 times the boost I got from messing around with multiple files for the sequential inserts case last time (see here and here for details).
The best performance I could get from having data on the SCSI arrays was 1595 seconds.
Representative wait stats for a run of this test – one file:
WaitType Wait_S Resource_S Signal_S WaitCount Percentage
—————————— ————– ————– ————– ———– ———-
PAGEIOLATCH_EX 28993.08 28984.66 8.42 647973 75.53
WRITELOG 7333.36 6883.82 449.54 3223809 19.10
SLEEP_BPOOL_FLUSH 1786.18 1781.94 4.24 1147596 4.65
Representative wait stats for a run of this test – two files:
WaitType Wait_S Resource_S Signal_S WaitCount Percentage
—————————— ————– ————– ————– ———– ———-
PAGEIOLATCH_EX 15306.22 15296.67 9.55 679281 63.87
WRITELOG 7762.25 7270.79 491.47 3215377 32.39
Representative wait stats for a run of this test – four files:
WaitType Wait_S Resource_S Signal_S WaitCount Percentage
—————————— ————– ————– ————– ———– ———-
PAGEIOLATCH_EX 26833.45 26822.85 10.60 867558 75.88
WRITELOG 7097.77 6647.26 450.51 3221475 20.07
Representative wait stats for a run of this test – eight files:
WaitType Wait_S Resource_S Signal_S WaitCount Percentage
—————————— ————– ————– ————– ———– ———-
PAGEIOLATCH_EX 27556.79 27547.83 8.96 674319 75.09
WRITELOG 7545.40 7118.93 426.47 3221841 20.56
Representative wait stats for a run of this test – sixteen files:
WaitType Wait_S Resource_S Signal_S WaitCount Percentage
—————————— ————– ————– ————– ———– ———-
PAGEIOLATCH_EX 37716.72 37705.87 10.85 792189 80.13
WRITELOG 7150.01 6699.36 450.64 3228609 15.19
These numbers are showing the majority of waits are for data pages to be read into the buffer pool – random reads, and the next most prevalent wait is for log block flushes to complete. The more PAGEIOLATCH_EX waits there are, the worse the performance is.
Data on 640GB RAID-0 SSDs, log on SATA RAID-10
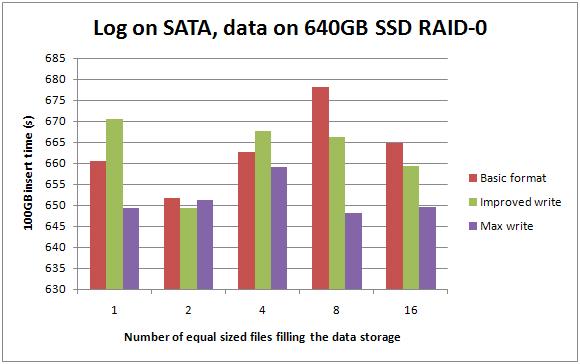
Don't let this graph fool you – the top and bottom of the scale are only 30 seconds apart. Basically moving the data files from the SCSI arrays to the RAID-0 SSD got around a 3-5x performance gain, no matter how the SSDs are formatted.
Representative wait stats for a run of this test – one file:
WaitType Wait_S Resource_S Signal_S WaitCount Percentage
—————————— ————– ————– ————– ———– ———-
WRITELOG 8459.65 7789.91 669.73 3207448 94.48
PAGEIOLATCH_EX 440.27 392.51 47.77 828420 4.92
Representative wait stats for a run of this test – two, four, eight, or sixteen files:
WaitType Wait_S Resource_S Signal_S WaitCount Percentage
—————————— ————– ————– ————– ———– ———-
WRITELOG 7957.35 7356.01 601.34 3206855 95.75
The log is the obvious bottleneck in this configuration.
Data and log on 640GB RAID-0 SSDs
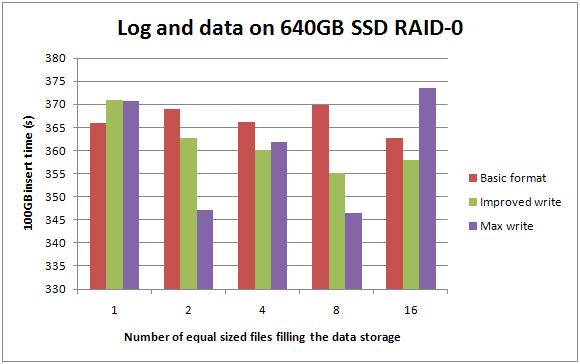
And again – high and low values are only 25 seconds apart. Moving log off to the same SSD gave a further 45%-ish improvement across the board, with little difference according to how the SSDs were formatted.
Representative wait stats for a run of this test – any number of files:
WaitType Wait_S Resource_S Signal_S WaitCount Percentage
—————————— ————– ————– ————– ———– ———-
WRITELOG 2955.69 2184.99 770.69 3203957 89.24
PAGEIOLATCH_EX 330.11 288.89 41.23 653147 9.97
The percentages fluctuate up and down a few percent depending on write format and number of files, with the maximum write performance format tending to have a slightly higher percentage of WRITELOG waits than the other two formats.
Note that moving the log to the SSD as well as the data files drastically cuts down the number of WRITELOG waits – what we'd expect.
Data and log on single 320GB SSD
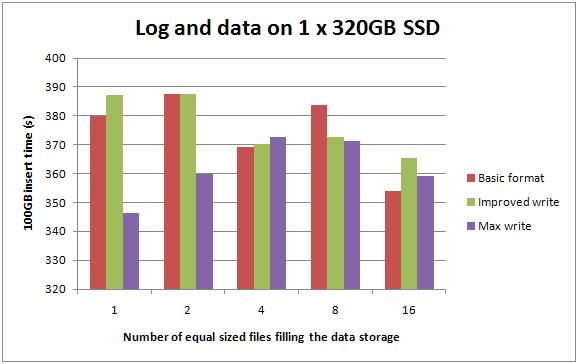
The performance numbers for having everything on a single 320GB SSD are only a tiny amount slower than those for two 320GB SSDs – which is what I'd expect.
Representative wait stats for a run of this test – one file with basic format or improved write performance format:
WaitType Wait_S Resource_S Signal_S WaitCount Percentage
—————————— ————– ————– ————– ———– ———-
WRITELOG 2911.22 2121.05 790.17 3204459 81.44
PAGEIOLATCH_EX 602.11 546.56 55.55 758271 16.84
And for one file with maximum write performance format:
WaitType Wait_S Resource_S Signal_S WaitCount Percentage
—————————— ————– ————– ————– ———– ———-
WRITELOG 3363.11 2523.63 839.48 3204110 87.54
PAGEIOLATCH_EX 428.68 406.77 21.92 412081 11.16
You can see that the higher amount of PAGEIOLATCH_EX waits leads to lower overall performance. This makes sense to me.
Data and log on two 320GB RAID-1 SSDs
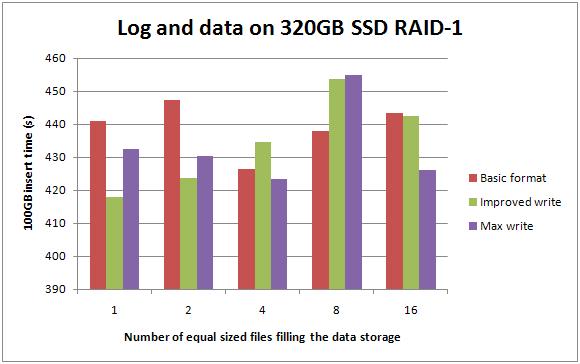
Now, I have an issue with people using SSDs in RAID-0 because it's a single point of failure. In an environment that's going all out on high-availability, if I was using SSDs for performance, depending on the criticality of the data I'd want to at least double-up to RAID-1. For all the various configurations, moving from a single 320GB SSD to two of them in RAID-1 resulted in no more than a 10-15% drop in performance and it's still 3-5x faster than the SCSI setup.
Here's a representative set of wait stats for the entire set of tests:
WaitType Wait_S Resource_S Signal_S WaitCount Percentage
—————————— ————– ————– ————– ———– ———-
WRITELOG 3949.44 3031.14 918.30 3204694 85.68
PAGEIOLATCH_EX 608.62 555.98 52.65 692934 13.20
In general the RAID-1 configuration had more waits of both types than the single drive configuration.
Data and log on separate 320GB SSDs
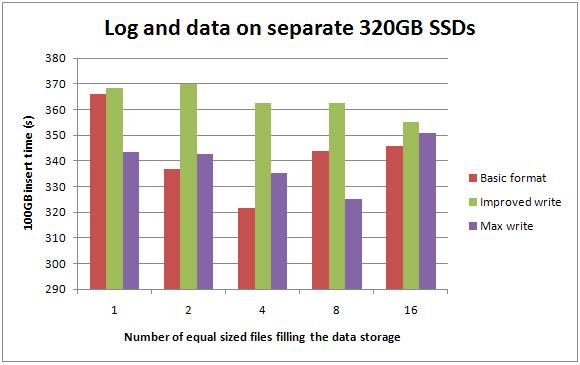
Splitting the data and log make for a 5-20% improvement over having everything on a single 320GB SSD.
The wait stats for these configurations show the same trends that we've seen so far – slightly slower performance = slightly more PAGEIOLATCH_EX waits.
Data and log round-robin between separate 320GB SSDs
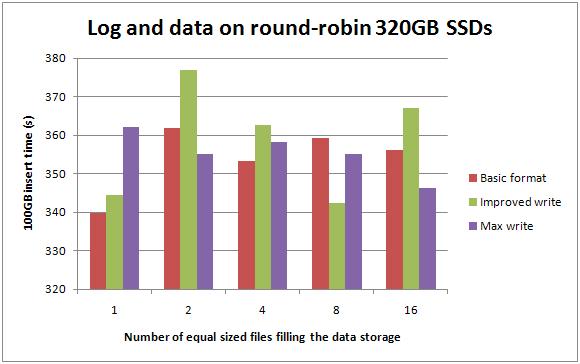
This confused me – the single file case is exactly the same configuration as the test case above, but the results (for each test being run 5 time and then averaged) were almost 10% faster for the first two formats. No significant differences for the other configurations.
The wait stats for these configurations show the same trends that we've seen so far – slightly slower performance = slightly more PAGEIOLATCH_EX waits.
Best-case performance for each number of data files
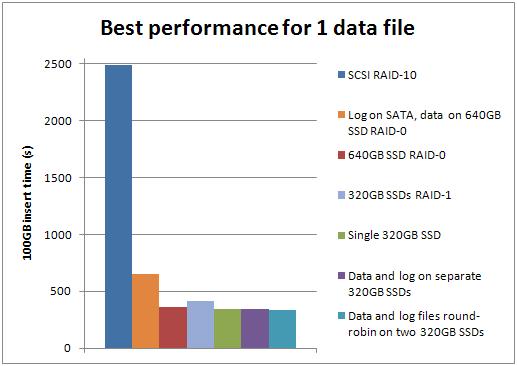
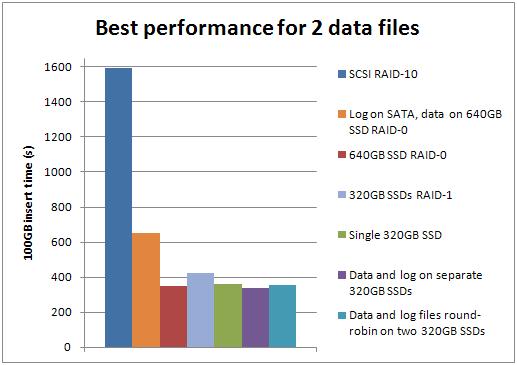
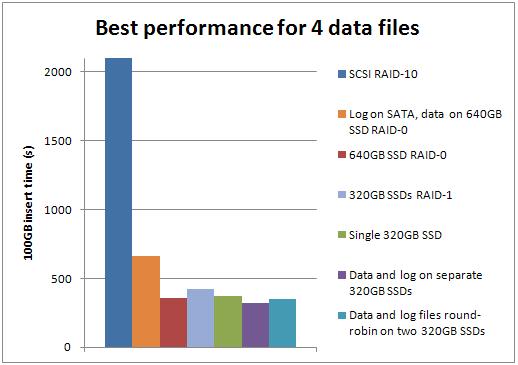
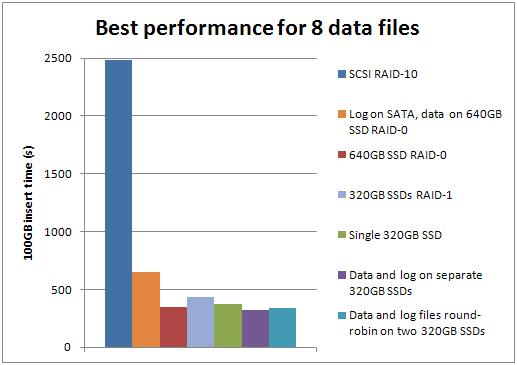
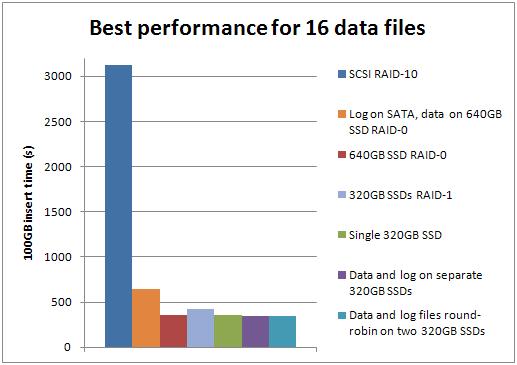
Well big surprise – the SSDs outperform the SCSI storage for all these tests. The improvement factor varied by the number of data files:
- 1: SSD was 7.25x faster than SCSI
- 2: SSD was 4.74x faster than SCSI
- 4: SSD was 6.81x faster than SCSI
- 8: SSD was 7.64x faster than SCSI
- 16: SSD was 9.03x faster than SCSI
The configuration of 4 data files on one SSD and the log on the other SSD, with basic format for both, was the best overall performer, beating the best SCSI configuration (2 data files) by a factor of 4.96.
Summary
Reminder: this test was 32 million inserts with no reads or updates (i.e. no random IO). It is very important to consider the limited scenario being tested and to draw appropriate conclusions.
My conclusions are as follows:
- For a random read+write workload, the method of formatting the Fusion-io drives doesn't make much difference. I'd go for the basic format to get the higher capacity, but I'd always to a representative load test to make sure.
- For a random read+write workload, the SSDs give at least a 5x performance gain over iSCSI storage
- Once again, having multiple data files outperforms having a single data file in most configurations
- I can easily correlate IO-subsystem related wait stats to the varying performance of the various configurations
Compared to the sequential insert workload that I benchmarked in the previous set of tests, the random read+write workload makes it worth investigating the investment of moving to SSDs.
Just like last time, these results confirm what I'd heard anecdotally – random operations are the sweet-spot for SSDs.
Brent's playing with the server over the next 4 weeks so I won't be doing any more benchmarking until mid-September at least.
Hope these results are interesting to you!

3 thoughts on “Benchmarking: Introducing SSDs (Part 3: random inserts with wait stats details)”
Good to see you continuing the FusionIO research Paul.
I think this test highlights how random writes are mainly bound by *reading* those pages into the data cache first. This is also my main message about FusionIO – it optimises the read component of database writes, which is where HDDs fall down due to rotational latency.
I’d like to see what happens when you include random read activity into the same test, as the HDDs would obviously degrade much further than the SSDs. Even though you’re using GUIDs to simplify achieving random writes, this mix of random writes / reads is fairly close to what happens in most OLTPs.
FusionIO / SSDs optimise random writes by optimising the read component of those writes..