(Check out my Pluralsight online training course: SQL Server: Performance Troubleshooting Using Wait Statistics and my comprehensive library of all wait types and latch classes.)
Two weeks ago I kicked off a survey that presented a scenario and asked you to vote for the wait type you’d be most worried to see after a code roll-out to production.
Here are the results:
Check It Out!

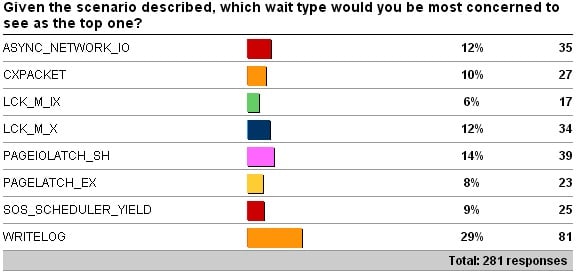
A very interesting spread of responses – thank you to all who thought about it and responded.
Remember, you have no other information apart from what the top wait type is over the week since the new code was rolled out. No knowledge of the I/O subsystem, memory, workload, code, or anything else. And that makes it a bit hard to pick what the most worrying wait type would be.
Let’s quickly consider what each of the wait types listed above could mean (and this is by no means an exhaustive examination of each wait type):
- ASYNC_NETWORK_IO: the classic cause of this wait type is RBAR (Row-By-Agonizing-Row) processing of results in a client, instead of caching the results client-side and telling SQL Server to send more. A common misconception is that this wait type is usually caused by network problems – that’s rarely the case in my experience.
- CXPACKET: this wait type always accrues when parallelism happens, as the control thread in a parallel operation waits until all threads have completed. However, when parallel threads are given unbalanced amounts of work to do, the threads that finish early also accrue this wait type, leading to it maybe becoming the most prevalent. So this one could be benign, as the workload has lots of good parallelism, but could be malignant if there’s unwanted parallelism or problems causing skewed distribution of work among parallel threads.
- LCK_M_IX: this wait type occurs when a thread is waiting for a table or page IX lock so that a row insert or update can occur. It could be from lock escalation to a table X or S lock causing all other threads to wait to be able to insert/update.
- LCK_M_X: this wait type commonly occurs when lock escalation is happening. It could also be caused by using a restrictive isolation level like REPEATABLE_READ or SERIALIZABLE that requires S and IS locks to be held until the end of a transaction. Note that distributed transactions change the isolation level to SERIALIZABLE under the covers – something that’s bitten several of our clients before we helped them. Someone could also have inhibited row locks on a clustered index causing all inserts to acquire page X locks – this is very uncommon though.
- PAGEIOLATCH_SH: this wait type occurs when a thread is waiting for a data file page to be read into memory. Common causes of this wait being the most prevalent are when the workload doesn’t fit in memory and the buffer pool has to keep evicting pages and reading others in from disk, or when query plans are using table scans instead of index seeks, or when the buffer pool is under memory pressure which reduces the amount of space available for data.
- PAGELATCH_EX: the two classic causes of this wait type are tempdb allocation bitmap contention (from lots of concurrent threads creating and dropping temp tables combined with a small number of tempdb files and not having TF1118 enabled) and an insert hotspot (from lots of concurrent threads inserting small rows into a clustered index with an identity value, leading to contention on the index leaf-level pages). There are plenty of other causes of this wait type too, but none that would commonly lead to it being the leading wait type over the course of a week.
- SOS_SCHEDULER_YIELD: the most common cause of this wait type is that the workload is memory resident and there is no contention for resources, so threads are able to repeatedly exhaust their scheduling quanta (4ms), registering SOS_SCHEDULER_YIELD when they voluntarily yield the processor. An example would be scanning through a large number of pages in an index. This may or may not be a good thing.
- WRITELOG: this wait type is common to see in the first few top waits on servers as the transaction log is often one of the chief bottlenecks on a busy server. This could be caused by the I/O subsystem not being able to keep up with the rate of log flushing combined with lots of tiny transactions forcing frequent flushes of minimal-sized log blocks.
So which one would *I* be most worried about seeing after a week of running the new code? The biggest problem is that we don’t know what the pattern of wait statistics was before the code roll-out, so we don’t know what’s normal for this production system, and it’s always better to have a baseline (or multiple snapshots) of wait statistics to compare with. We also don’t know what *other* wait types were the next few most prevalent types.
I’d be unsurprised to see ASYNC_NETWORK_IO, CXPACKET, PAGEIOLATCH_SH, or WRITELOG as the top wait, and I’d be intrigued to see SOS_SCHEDULER_YIELD as the top wait as that’s very uncommon. None of these would be the most worrying IMHO. PAGELATCH_EX would mean there’s a big bottleneck somewhere, which may be easy to alleviate (if in tempdb) or not, but queries would still be progressing.
And that leaves the two locking waits. When I designed the survey and scenario, I had it in mind that LCK_M_IX would be the most worrying as it would likely be from a bunch of threads waiting for other long-running, many-row updates to complete under an escalated table X lock. Now, thinking more about LCK_M_X, there would have to be a lot of blocked lock escalations happening to cause this – but in the meantime other queries are progressing.
I sat back for ten minutes after writing the last paragraph and thought about it some more, and came to a conclusion: LCK_M_IX is what I’d be most worried about. Most of the other waits are likely to be very small in duration, and although they’d make the overall system be slower, the locking waits can easily cause individual queries to time out and fail, leading to a very poor user experience. Although the fix for the locking waits could be as simple as enabling read-committed snapshot isolation (and paying attention to tempdb configuration and performance), the overall user experience is my primary concern, hence my biggest worry is the wait that could have the biggest effect on someone’s use of the system.
Now remember, this thought experiment was conducted with a very contrived scenario, and my reasoning is based on that. And it’s just my reasoning. More than 90% of you thought differently about your answer, which doesn’t mean either of us is wrong, just that we analyzed the scenario in a different way. A lot of it comes down to deciding what it is that makes you worried: user impact, overall workload performance, cost/complexity to alleviate, or something else. I picked user impact.
Some of you may cynically think I picked LCK_M_IX as it’s the answer that had the fewest responses, but if you ask Erin or Jon, they’ll tell you that I ran the survey past them (at lunch during our IE2 class two weeks ago) and told them my answer would be LCK_M_IX.
I’m interested to hear your thoughts on my pick and the scenario, but please don’t rant about how I’m wrong or the scenario is bogus, as there is no ‘right’ answer, just opinions based on experience.
And that’s the trick when it comes to performance troubleshooting – although it’s an art and a science, so much of how you approach it is down to your experience.
Happy troubleshooting!
PS Don’t forget to run the code from my previous post and get some free insight from me into your production wait statistics.
32 thoughts on “What is the most worrying wait type?”
My strategy of picking the wait I’ve never seen causing critical performance issues turns out to be the winner. :-) I knew a server can survive the rest, so the remainder must be really bad if you see it at the top. I completely cheated, actually, since I spent no time at all thinking about *why* LCK_M_IX might be so bad.
The question is a bit nasty in that it isn’t really useful to know what you would be *most* worried about *if* you saw it — of course troubleshooting is always about what you’re *actually* seeing. In that sense I’m not surprised people seem to have gone for the things they’re used to seeing when troubleshooting performance. That WRITELOG would come out on top was practically a given, even though, obviously, if it’s so common it’s extremely probable that it’s *not* the most worrisome thing you can see out of the alternatives offered.
No, the question isn’t nasty, and it is useful (remember I said above ‘please don’t rant about how I’m wrong or the scenario is bogus’) – people need to be challenged to think through why they react to certain wait types. Just because one is used to seeing certain waits, doesn’t mean they’re the most worrisome if one understands the reasons the waits occur and what effects they could symptoms of. I didn’t think it would be a given that WRITELOG came out on top – I was quite surprised in fact that there was one that had a clear majority of votes.
Now I’m sorry you didn’t offer some sort of bet on the side, because I would have been comfortable betting a month’s salary on WRITELOG coming out on top. :-) People are most challenged to think when they’re solving actual problems, not when confronted with hypotheticals — this has nothing to do with your question being bad, it’s just simple pragmatism (or, if you prefer, a certain tunnel vision). Please allow me to quickly point out that this is neither a rant nor am I accusing the scenario of being “bogus” — far from it. Thought experiments have led to some of the greatest scientific breakthroughs. I am merely pointing out that questions like these are inherently harder to answer than simple “if A then B” quizzes, and it should come as no surprise that you can therefore expect the answers that require less thought. This is notwithstanding the fact that any professional should be comfortable answering “what-if” questions to the best of their ability, regardless of the nature of the scenario.
I actually picked WRITELOG because when I’ve seen it, there has been poor disk performance on the transaction log, leading to very slow servers.
There’s some trickiness, of course – “a code rollout” shouldn’t significantly increase WRITELOG waits in most circumstances without additional information (e.g.”A code rollout OF A NEW APPLICATION…”, i.e., more traffic – maybe we’ve flooded the t-log). So, yeah, I can see that as being a poor answer, and I can’t fault anyone but me, for not thinking through all of the information provided.
But if it were just “in general” – I wonder if there might be different perspectives. I would see WRITELOG, in general, as being worrisome because I don’t tend to work on high-end servers. Whereas someone who works on the busiest, best tuned servers might have learned to more or less ignore it as long as it doesn’t show as a serious bottleneck.
Paul, I think this might be a pretty good interview question. Getting the “right” answer less important than seeing if a candidate could think through some reasons why (and if they asked about a baseline).
Andy
Absolutely – especially if they can give more reasons that just “it’s the most common one to see so must be the most worrying”. I think I’ll conduct some more of these type of quizzes.
I like to ask this question as well in an interview. Get a feeling about what they know and how deep they can go. Its not your level 100 stuff for sure. Good article as always! =)
That’s a great idea Andy!! I like it.
I approached the problem from the standpoint of having to fix it (or at least figure out whose sandbox it was in. 8) I picked ASYNC_NETWORK_IO as the most worrisome wait type in this scenario … because:
o it suggests possible problem with application
— from outside vendor
In hindsight, that seems to have been just my assumption
and I also seemed to have assumed that things were OK (or at least no complaints) before.
— that had just been rolled out.
— and, thus, something that I have little insight into and even less control over.
o RBAR and other sins by this application could, in turn, lead to a number of the other wait states.
— bushels of table and index scans
— misuse/abuse of temp tables; poor schema design (no PK, poorly chosen PK…) ; poor query design …
(etc., etc. — I’ll stop here ’cause I’ve exceed my “tweet” char limit for commenting. 8)
all in all, thanks for the gedankenexperiment. Look forward to more
I missed seeing this survey earlier, so I came in cold today, but my first thought was locking and blocking which would have been LCK_M_xx
I see alot of those on our servers as our OLTP app is hit pretty hard. And we use nHibernate (unfortunately). Every now and then after deployments, the locking and blocking is effected. And we have to make fixes accordingly. Thanks Paul for the topic.
Another classic cause of ASYNC_NETWORK_IO is restoring a database log. If you have a restore going on during your interval, remember the cumulative wait time for this can be very significant.
You mean ASYNC_IO_COMPLETION. ASYNC_NETWORK_IO is only for communication of results to client connections.
Hi all,
i would say all are worrisome except ASYNC_NETWORK_IO, it all depends on your system, server, application……
each one will define a certain issue or sometimes multiple ones, as DBAs we should always troubleshoot whatever nasty waittype we are dealing with. so my answer is “IT DEPENDS ;)”
I have a question about this statement:
“Note that distributed transactions change the isolation level to SERIALIZABLE under the covers – something that’s bitten several of our clients before we helped them.”
Can you elaborate? I have tested this and I show the transactions being at read committed from sessions table.
Thanks in advance!
Jared
Yup – but under the covers it’s doing serializable. Nothing else to explain.
Thanks Paul! I assume you are saying that we won’t see it as such in DMVs, but to trust you that it is serializable lol And… I do trust you.
I tried to prove this out by explicitly starting a distributed transaction to a linked server with a SELECT * and then went over to the other server and issued an update on that table. The update was not blocked even though I never committed/rolled back the distributed transaction. Any chance you can do a blog post or something demonstrating this?
Thanks!
Jared, perform the update with no commit and then run a bunch of selects and see what you find. I use cmd shell scripts to call the select’s with sqlcmd so you can see it hanging and also a script from a Ken Henderson book to find the root blocker along with a sp_who2 custom script to filter out back ground processes.
This was a awesome article I have an arsenal of DMV’s deployed on my servers for various troubled areas of interest when needed. You can use sqlps as a wrapper and have it run the specific DMV’s of interest and it will land them in a csv file quite quickly and nicely for review. Then you can build in a input box to go fetch the metrics from a remote machine for the quick performance metric capture to help with your diagnostics.
An update without a commit will lock even in a read committed scenario. It is only the select without a commit that will act this way in serializable. Am I thinking about this incorrectly?
IS there a way disable DTC from changing to serializable? my customer moved from oracle to sql and they are having issues becauase of this. so if we can some how keep the transactions read committed, this issue will be resolved.
Nope – it’s an internal setting that cannot be changed.
Kevin Kline’s article was also awesome and is what led me to read over here. I have 16 years of SQL experience and never stop learning.
Ed,
learned a lot today. Thanks Paul
Awesome post.
For me the troublesome wait type at first was ASYNC_NETWORK_IO.. But once I fixed this, the next probable wait type in my list was CXPACKET.
Still playing around to set the MAXDOP settings to have the best performance.
Hi Paul,
one of my customers sent me an wait type I nevver seen before.
wait type: BTBUILD
wait resource: SyncPoint
I cant find informations about that.
Thanks Andreas
I don’t have any info on that wait type – you’ll need to capture call stacks to figure out where it’s coming from.
Ok, thanks!
You say that you would be intrigued if you saw SOS_SCHEDULER_YIELD as the top wait type.
We’ve been seeing it quite a lot recently and it appears to be caused by bad plan management and the use of forced parameterization rather than simple.
It’s causing a VM with 8(v) CPU + 128Gb of memory to pin at 100% CPU for extended periods of time.
Nice Article and learned a Lots of things.
Hi Paul,
Have you seen a case where LCK waits, like LCK_M_S with bad average wait times (500ms+) *cause* bad IO performance that manifests itself in extreme Write IO latency metrics (seconds), average disk queue length values (in the range of hundreds)? Or rather, bad IO performance is causing the bad LCK waits? In general, blocking chains show head blockers tend to have PAGEIOLATCH_UP waits in tempdb and these block sessions waiting with LCK_M_S waits. So what is the causation in your opinion?
Locking issues wouldn’t ever cause slow I/O. It’s an I/O issue that’s causing locks to be held longer that causes the blocking.
Thanks Paul! I think the very same, have never seen a SQL Server myself where locking issues caused slow IO, vice versa yes, hundreds, but I am in the position that I am always open to learn something new… As it is claimed by others, now I need to think about a way to absolutely prove our point, Perfmon itself seems to be not enough!!! (sigh). I thought about correlating Perfmon with blocking chains and wait stats, but I think that whatever metrics I come up with, does not matter, plus I do not own the VM environment, can’t see “outside the box”, so having a new pre-calibrated environment with the storage layer (diskspd.exe in advance) might be more direct proof. Funny thing is that pssdiag metrics were collected by 3rd party, but the conclusion was that locks cause IO problems, the IO problems as symptoms are “false”, even if the head blockers are having PAGEIOLATCH_UP and sometimes WRITELOG waits. Can’t see them correlating Perfmon with blocking chains either. Mainly tempdb suffers heavily, can see subpar IO performance metrics on all drives though, and no memory pressure in the box. The argument is about causation. I can only guess that you are having similar rounds with vendors all the time in your consultant job :)