(Check out my Pluralsight online training course: SQL Server: Performance Troubleshooting Using Wait Statistics and my comprehensive library of all wait types and latch classes.)
It’s all very well having whizz-bang 3rd-party performance monitoring and troubleshooting tools, but sometimes you have to get deeper into what’s going on with SQL Server than any of these tools can go. Or you have to call Customer Support or Premier Support so *they* can dive in deeper.
Typically you or they are going to make use of four DMVs that give increasingly advanced information about what’s going on for use in performance troubleshooting:
- sys.dm_os_wait_stats
- sys.dm_os_waiting_tasks
- sys.dm_os_latch_stats
- sys.dm_os_spinlock_stats (this one isn’t documented at all and is only mentioned in a few places online)
A few weeks ago I kicked off a survey to find out whether you’ve heard of or used these DMVs. In this post I’m going to present the survey results and explain a bit about these DMVs, focusing the most attention on latches and spinlocks. This started out as a small post but grew into a 10-page, 2500 word article :-)
Here are the results (in each of the Other values, a few people asked what DMVs are – see Dynamic Management Views and Functions in BOL).
sys.dm_os_wait_stats
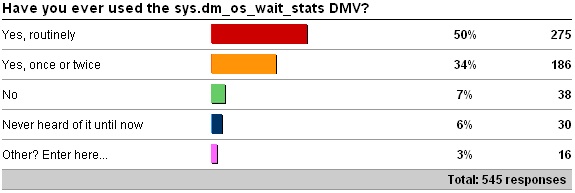
Other values:
- 12 x Yes, more than once or twice but not routinely.
- 2 x Only because of your wait statistics post.
The survey results are not surprising, especially among readers of my blog.
Wait statistics are the bread-and-butter of performance tuning. SQL Server is keeping track of what resources threads need to wait for, and how long they need to wait. By analyzing which resources (and combinations of resource) are being waited for the most, you can get an idea of where to start digging in further. An example might be that if most of the waits are PAGEIOLATCH_SH waits, and this wasn’t the case in your wait stats baseline, you might look at the I/O subsystem performance using the sys.dm_io_virtual_file_stats DMV (which I blogged about here).
Last December I wrote a long blog post introducing wait statistics, showing how to use the sys.dm_os_wait_stats DMV, giving links to resources, and explaining the most common ones that people see in the field based on data from more than 1800 SQL Servers – see Wait statistics, or please tell me where it hurts.
sys.dm_os_waiting_tasks
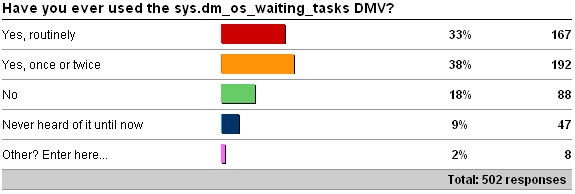
Other values:
- 6 x Yes, More than once or twice but not routinely.
I’m surprised that these results don’t tie in more closely with the results for sys.dm_os_wait_stats, but they’re reasonably close.
The sys.dm_os_waiting_tasks DMV shows you what is currently being waited on by everything running on the system.
I created a scenario with 200 clients creating and dropping small temp tables to create tempdb latch contention. Using the DMV, I can see what’s being waited on (I’ve removed the columns describing blocking from the output in this case to make it fit on screen):
SELECT * FROM sys.dm_os_waiting_tasks;
GO
waiting_task_address session_id exec_context_id wait_duration_ms     wait_type          resource_address   resource_description
-------------------- ---------- --------------- -------------------- ------------------ ------------------ --------------------
0x000000000044E508   2          0               4091305              XE_DISPATCHER_WAIT NULL               NULL
0x000000000044E988   9          0               4121252              FSAGENT            NULL               NULL
0x000000000044EBC8   20         0               4121251              BROKER_TRANSMITTER NULL               NULL
0x000000000044F4C8   63         0               53                   PAGELATCH_EX       0x0000000088FFEED8 2:1:1139
0x000000000044EE08   64         0               8                    PAGELATCH_UP       0x0000000080FE8AD8 2:1:1
0x000000000044F288   87         0               0                    PAGELATCH_UP       0x0000000080FE8AD8 2:1:1
0x000000000044F048   91         0               53                   PAGELATCH_EX       0x0000000088FFEED8 2:1:1139
0x000000000044F948   92         0               61                   PAGELATCH_EX       0x0000000088FFEED8 2:1:1139
0x000000000044F708   101        0               10                   PAGELATCH_EX       0x0000000080FEEC58 2:1:120
0x000000000044FDC8   103        0               37                   PAGELATCH_UP       0x0000000080FE8AD8 2:1:1
0x000000008744E088   118        0               11                   PAGELATCH_EX       0x0000000080FEEC58 2:1:120
0x000000008744E2C8   121        0               66                   PAGELATCH_UP       0x0000000080FE8AD8 2:1:1
0x000000008744E508   122        0               33                   PAGELATCH_EX       0x0000000080FEEC58 2:1:120
0x000000008744E748   155        0               32                   PAGELATCH_EX       0x0000000080FEEC58 2:1:120
0x000000008744E988   158        0               27                   PAGELATCH_EX       0x0000000080FEEC58 2:1:120
0x000000008744EBC8   163        0               34                   PAGELATCH_EX       0x0000000080FEEC58 2:1:120
0x000000008744EE08   168        0               66                   PAGELATCH_UP       0x0000000080FE8AD8 2:1:1
0x000000008744F048   179        0               26                   PAGELATCH_UP       0x0000000080FE8AD8 2:1:1
.
.
As you can see, the classic tempdb latch contention is showing – page ID (2:1:1) – the first PFS page in tempdb. (See here for more on tempdb contention, and here for more on PFS pages.)
My colleague Joe Sack created a script that pulls in data from a bunch of other DMVs to make the sys.dm_os_waiting_tasks output more useful, which I’ve modified into the following (note that ‘text’ on one line does not have delimiters because that messes up the code formatting plugin):
SELECT
    [owt].[session_id],
    [owt].[exec_context_id],
    [ot].[scheduler_id],
    [owt].[wait_duration_ms],
    [owt].[wait_type],
    [owt].[blocking_session_id],
    [owt].[resource_description],
    CASE [owt].[wait_type]
        WHEN N'CXPACKET' THEN
            RIGHT ([owt].[resource_description],
                CHARINDEX (N'=', REVERSE ([owt].[resource_description])) - 1)
        ELSE NULL
    END AS [Node ID],
    --[es].[program_name],
    [est].text,
    [er].[database_id],
    [eqp].[query_plan],
    [er].[cpu_time]
FROM sys.dm_os_waiting_tasks [owt]
INNER JOIN sys.dm_os_tasks [ot] ON
    [owt].[waiting_task_address] = [ot].[task_address]
INNER JOIN sys.dm_exec_sessions [es] ON
    [owt].[session_id] = [es].[session_id]
INNER JOIN sys.dm_exec_requests [er] ON
    [es].[session_id] = [er].[session_id]
OUTER APPLY sys.dm_exec_sql_text ([er].[sql_handle]) [est]
OUTER APPLY sys.dm_exec_query_plan ([er].[plan_handle]) [eqp]
WHERE
    [es].[is_user_process] = 1
ORDER BY
    [owt].[session_id],
    [owt].[exec_context_id];
GO
There’s too much information in the output to usefully show in this post, but I can see the actual T-SQL statements being run (in this case a lot of DROP TABLE and SELECT * INTO of global temp tables) and the XML query plans. Clicking on one of them in SSMS gives me the actual plan – very cool:
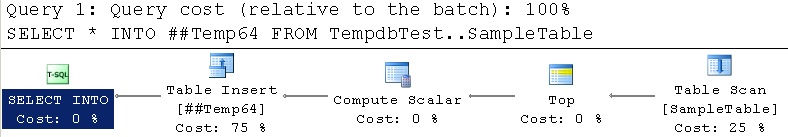
This means I can see from the sys.dm_os_wait_stats DMV what the prevalent resource waits are, then use the sys.dm_os_waiting_tasks DMV to see which queries are waiting for those resources – and then dive in deeper to see why.
sys.dm_os_latch_stats
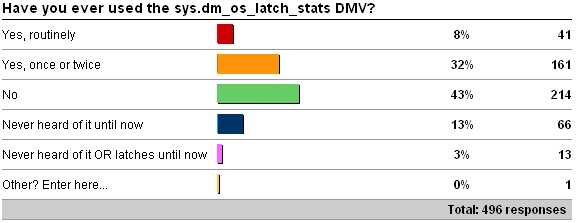
As I suspected most readers have heard of latches, but 75% of respondents haven’t used the DMV or have only used it once or twice.
A latch is a lightweight synchronization mechanism that protects access to read and change in-memory structures – for instance, 8KB page buffers in the buffer pool (latch class = BUFFER), or the data structure that represents a database’s data and log files (latch class = FGCB_ADD_REMOVE). A latch is only held for the duration of the operation, unlike a lock which may be held until a transaction commits. One example of locks and latches – imagine a table where an update query has caused lock escalation so that a table X lock is held on the table. As the query continues updating more records in the table, it won’t acquire any more locks, but any data and index pages that are updated in memory must be EX (exclusive) latched before the update can occur. The latch acts as the synchronization mechanism to prevent two threads updating the page at the same time, or a thread reading the page while another is in the middle of updating it. Another example is if you run a select query using NOLOCK – although the query will not acquire SH (share) locks at any level in the table, the threads must acquire SH latches on pages before they can be read – to synchronize with possible concurrent updaters.
If a thread requires a latch it will be moved from RUNNING to SUSPENDED and put on the waiter list to await notification that the latch has been acquired in the requested mode.
Latch waits correspond to LATCH_XX waits in the output from the sys.dm_os_wait_stats DMV, so digging into to which latches are accounting for most waits can show where a bottleneck is on the system.
You can reset latch wait statistics just like regular wait statistics using:
DBCC SQLPERF('sys.dm_os_latch_stats', CLEAR);
GO
An example set of output from the DMV is:
SELECT * FROM sys.dm_os_latch_stats
WHERE [waiting_requests_count] > 0
ORDER BY [wait_time_ms] DESC;
GO
latch_class                       waiting_requests_count wait_time_ms         max_wait_time_ms
--------------------------------- ---------------------- -------------------- --------------------
BUFFER                            113181121              466697044            1233
ACCESS_METHODS_HOBT_COUNT         66676                  331193               577
ACCESS_METHODS_HOBT_VIRTUAL_ROOT  15018                  68865                125
LOG_MANAGER                       130                    5610                 234
FGCB_ADD_REMOVE                   299                    5073                 32
TRACE_CONTROLLER                  1                      0                    0
VERSIONING_TRANSACTION_LIST       1                      0                    0
ACCESS_METHODS_HOBT_FACTORY       64                     0                    0
You can also aggregate them in the same way as I described in my big wait stats blog post, using code below:
WITH [Latches] AS
	(SELECT
		[latch_class],
		[wait_time_ms] / 1000.0 AS [WaitS],
		[waiting_requests_count] AS [WaitCount],
		100.0 * [wait_time_ms] / SUM ([wait_time_ms]) OVER() AS [Percentage],
		ROW_NUMBER() OVER(ORDER BY [wait_time_ms] DESC) AS [RowNum]
	FROM sys.dm_os_latch_stats
	WHERE [latch_class] NOT IN (
		N'BUFFER')
	--AND [wait_time_ms] > 0
	)
SELECT
	MAX ([W1].[latch_class]) AS [LatchClass],
	CAST (MAX ([W1].[WaitS]) AS DECIMAL(14, 2)) AS [Wait_S],
	MAX ([W1].[WaitCount]) AS [WaitCount],
	CAST (MAX ([W1].[Percentage]) AS DECIMAL(14, 2)) AS [Percentage],
	CAST ((MAX ([W1].[WaitS]) / MAX ([W1].[WaitCount])) AS DECIMAL (14, 4)) AS [AvgWait_S]
FROM [Latches] AS [W1]
INNER JOIN [Latches] AS [W2]
	ON [W2].[RowNum] <= [W1].[RowNum]
GROUP BY [W1].[RowNum]
HAVING SUM ([W2].[Percentage]) - MAX ([W1].[Percentage]) < 95; -- percentage threshold
GO
Here’s an example after clearing the latch stats and running the tempdb contention test (I described above) for 30 seconds:
LatchClass                        Wait_S  WaitCount  Percentage  AvgWait_S
--------------------------------- ------- ---------- ----------- ----------
ACCESS_METHODS_HOBT_COUNT         7.92    1471       75.41       0.0054
ACCESS_METHODS_HOBT_VIRTUAL_ROOT  1.38    393        13.15       0.0035
LOG_MANAGER                       1.20    12         11.44       0.1001
Most of the latch classes are undocumented, but I’ll be shedding light on them as I blog more about latch stats.
sys.dm_os_spinlock_stats
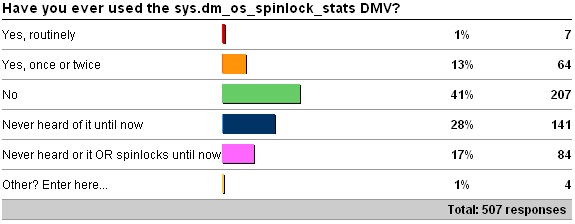
Other values:
- 1 x Just learned of this at SQLskills training!
- 1 x Learned about it, after you tweeted about it on 3/23 to a co-worker.
This is really cool that more than 40% of respondents have never heard of this DMV or spinlocks – education time!
A spinlock is another lightweight synchronization mechanism used to control access to certain data structures in the engine – used when the time that the spinlock will be held is very short. They are different from latches because a thread waiting for a latch will yield the scheduler and go onto the waiter list whereas a thread waiting to acquire a spinlock will burn some CPU “spinning” to see if it can get the CPU before giving up and backing off (yielding the scheduler) before trying again. This may allow another thread to execute that is holding the spinlock and eventually release it, allowing the system to proceed (yes, a thread can yield the scheduler and move to the waiter list while holding a spinlock!) because another thread can then acquire the spinlock.
It is perfectly normal for spinlock collisions and spins to occur on a busy system, but sometimes a bottleneck can occur on systems with larger numbers of CPUs where collisions are more likely – this can drain CPU resources while many threads are spinning trying to acquire the spinlock.
Running the DMV shows you the list of all spinlocks on the system (all of which are undocumented – but I’ll be working on that going forward) – here is some partial output:
SELECT * FROM sys.dm_os_spinlock_stats
ORDER BY [spins] DESC;
GO
name               collisions           spins                spins_per_collision sleep_time           backoffs
------------------ -------------------- -------------------- ------------------- -------------------- -----------
LOCK_HASH          3629624              4402099957           1212.825            561                  817819
SOS_CACHESTORE     11992297             3352117666           279.5226            6093                 71948
OPT_IDX_MISS_KEY   63329610             2036811058           32.16207            15830                180845
SOS_TLIST          9769744              574740437            58.82861            320                  3619
SOS_SCHEDULER      2137875              107392996            50.23352            557                  7753
MUTEX              676406               83493780             123.4374            340                  3300
LOGCACHE_ACCESS    2210697              83204315             37.63714            0                    252366
SOS_RW             264489               70122059             265.1228            14                   799
XDESMGR            346005               61031449             176.3889            216                  3788
SOS_SUSPEND_QUEUE  3397384              53752545             15.82174            120                  2384
OPT_IDX_STATS      129814               19800952             152.5332            27                   356
BACKUP_CTX         29730                16784471             564.5635            192                  1645
LOCK_RESOURCE_ID   17558                4363116              248.4973            20                   375
SOS_TASK           206597               1898063              9.187273            16                   171
XVB_LIST           266112               882691               3.316991            1                    63
.
.
On 2005 you’ll need to use DBCC SQLPERF (‘spinlockstats’) and use INSERT/EXEC to get the results into a table. Eric Humphrey (blog|twitter) put the code together:
IF OBJECT_ID (N'tempdb..#TempSpinlockStats1') IS NOT NULL
    DROP TABLE [#TempSpinlockStats1];
GO
CREATE TABLE [#TempSpinlockStats1] (
    [name]                NVARCHAR(30) NOT NULL,
    [collisions]          BIGINT NOT NULL,
    [spins]               BIGINT NOT NULL,
    [spins_per_collision] FLOAT NOT NULL,
    [sleep_time]          BIGINT NOT NULL,
    [backoffs]            BIGINT NOT NULL
);
INSERT INTO [#TempSpinlockStats1] EXEC ('DBCC SQLPERF(''spinlockstats'')');
GO
The LOCK_HASH spinlock, for instance, is used by the lock manager to look at one of the hash buckets holding lock resource hashes to tell whether lock can be granted or not.
The sleep_time is an aggregate of how much time is spent sleeping between spin cycles when a backoff occurs.
I’ve put together some code that will allow you to see what spinlock activity occurs between two times. The code captures the output from the DMV into two temp tables, with whatever time period you want in between (to allow you to run a command), and then shows the difference between the two sets of data. I’ll show an example of running DBCC CHECKDB.
IF EXISTS (SELECT * FROM [tempdb].[sys].[objects]
	WHERE [name] = N'##TempSpinlockStats1')
	DROP TABLE [##TempSpinlockStats1];

IF EXISTS (SELECT * FROM [tempdb].[sys].[objects]
	WHERE [name] = N'##TempSpinlockStats2')
	DROP TABLE [##TempSpinlockStats2];
GO

-- Baseline
SELECT * INTO [##TempSpinlockStats1]
FROM sys.dm_os_spinlock_stats
WHERE [collisions] > 0
ORDER BY [name];
GO

-- Now do something
DBCC CHECKDB (N'SalesDB') WITH NO_INFOMSGS;
GO

-- Capture updated stats
SELECT * INTO [##TempSpinlockStats2]
FROM sys.dm_os_spinlock_stats
WHERE [collisions] > 0
ORDER BY [name];
GO

-- Diff them
SELECT
    '***' AS [New],
    [ts2].[name] AS [Spinlock],
    [ts2].[collisions] AS [DiffCollisions],
    [ts2].[spins] AS [DiffSpins],
    [ts2].[spins_per_collision] AS [SpinsPerCollision],
    [ts2].[sleep_time] AS [DiffSleepTime],
    [ts2].[backoffs] AS [DiffBackoffs]
FROM [##TempSpinlockStats2] [ts2]
LEFT OUTER JOIN [##TempSpinlockStats1] [ts1]
    ON [ts2].[name] = [ts1].[name]
WHERE [ts1].[name] IS NULL
UNION
SELECT
    '' AS [New],
    [ts2].[name] AS [Spinlock],
    [ts2].[collisions] - [ts1].[collisions] AS [DiffCollisions],
    [ts2].[spins] - [ts1].[spins] AS [DiffSpins],
    CASE ([ts2].[spins] - [ts1].[spins]) WHEN 0 THEN 0
        ELSE ([ts2].[spins] - [ts1].[spins]) /
            ([ts2].[collisions] - [ts1].[collisions]) END
            AS [SpinsPerCollision],
    [ts2].[sleep_time] - [ts1].[sleep_time] AS [DiffSleepTime],
    [ts2].[backoffs] - [ts1].[backoffs] AS [DiffBackoffs]
FROM [##TempSpinlockStats2] [ts2]
LEFT OUTER JOIN [##TempSpinlockStats1] [ts1]
    ON [ts2].[name] = [ts1].[name]
WHERE [ts1].[name] IS NOT NULL
    AND [ts2].[collisions] - [ts1].[collisions] > 0
ORDER BY [New] DESC, [Spinlock] ASC;
GO
And the output is as follows:
New  Spinlock           DiffCollisions       DiffSpins            SpinsPerCollision DiffSleepTime        DiffBackoffs
---- ------------------ -------------------- -------------------- ----------------- -------------------- ------------
***  DBCC_CHECK         4                    24                   6                 0                    0
***  DIAG_MANAGER       1                    0                    0                 0                    0
***  FCB_REPLICA_SYNC   10                   16147                1614.7            0                    0
***  LSID               9                    0                    0                 0                    0
***  QUERYEXEC          5                    0                    0                 0                    0
***  X_PACKET_LIST      2                    0                    0                 0                    0
***  X_PORT             8                    227                  28.375            0                    0
***  XACT_WORKSPACE     11                   0                    0                 0                    0
***  XID_ARRAY          7                    0                    0                 0                    0
     BUF_FREE_LIST      2                    0                    0                 0                    0
     HOBT_HASH          2                    1                    0                 0                    0
     LOCK_HASH          3                    1818                 606               0                    0
     SOS_RW             2                    500                  250               0                    0
     SOS_SCHEDULER      5                    6                    1                 0                    0
     SOS_SUSPEND_QUEUE  11                   39                   3                 0                    0
     SOS_TASK           1                    0                    0                 0                    0
     SOS_TLIST          1                    0                    0                 0                    0
You can see here which spinlocks were acquired to run the DBCC CHECKDB commands – those marked with *** did not appear in the ‘before’ set of spinlock stats. More on all of these in future posts.
You can also investigate spinlocks using extended events – again, more on that in future.
Summary
It’s possible to dive really deeply into what’s happening inside SQL Server using these four DMVs. Spinlocks in particular – what each means, what each controls and what contention on each them means (plus what you can do about it) – involve a lot of knowledge of what’s going on inside the engine, and I’m planning to spread some of that knowledge going forward – there’s an enormous amount of information to be published about latches and spinlocks.
Hope you’ll join me to learn about these – let me know if you find this stuff interesting and useful.
Thanks!
15 thoughts on “Advanced SQL Server performance tuning”
Waiting for your book on the subject! :)
SQL Nexus provides a Spinlock Stats Summary report which can be quite useful when troubleshooting performance degradation issues caused by high memory consumption for TokenPerm cache store.
Paul,
Really didint heard of Spinlocks until…Thanks for shedding light on Spinlocks and latches. Though Im still confused on Spinlocks part eagerly waiting for the future posts on the same….
Thank you very much
Aditya
Hi Paul
Good stuff… I’ve been looking for more documentation on the spinlocks in particular for quite some time. I am very much looking forward to your next posts on this!
/Michael
Hi Paul,
I’m found this very useful and interesting and "waiting" for more …
Thanks
The problem I see with latch and spinlock waits is that I have no idea how to see if 1) they are a problem for server performance (sure, there may be a lot, but then we have servers to do work after all) and 2) if they are, how you are supposed to reduce them without the obvious answer of performing less work ("don’t do that, then"). Performance indicators that aren’t actionable are of no use.
I/O problems are easy to identify and likewise easy to remedy, if you know your stuff about query execution. Latches and spinlocks, not so much — you probably need to know *even more* about query execution. So I, too, am eagerly looking forward to future posts on the subject.
I changed
SELECT
wait_type,
waiting_tasks_count,
wait_time_ms,
wait_time_ms/ISNULL(NULLIF(waiting_tasks_count,0),1) AS Avg_wait_time,
wait_time_ms/(SELECT CAST(SUM(wait_time_ms) AS numeric) FROM sys.dm_os_wait_stats) AS percent_wait_of_total,
max_wait_time_ms
FROM sys.dm_os_wait_stats
ORDER BY Avg_wait_time DESC
to
SELECT
wait_type,
waiting_tasks_count,
wait_time_ms,
wait_time_ms/CAST(ISNULL(NULLIF(waiting_tasks_count,0),1) AS NUMERIC(18,6)) AS Avg_wait_time,
wait_time_ms/(SELECT CAST(SUM(wait_time_ms) AS numeric) FROM sys.dm_os_wait_stats) AS percent_wait_of_total,
max_wait_time_ms
FROM sys.dm_os_wait_stats
ORDER BY Avg_wait_time DESC
so the avg wait time could be less than zero
Paul Randal & Joe Sacks:
I know this post in a bit dated, but here I am trying to steal the SQL pertaining to “sys.dm_os_waiting_tasks”.
And, as always, when one is stealing there is always an anchor that tells you ‘re stealing, and you got to own up to it.
The bait that I choked on this time is the line that reads “[est].1”. The sure-tell sign that something is amiss is the error returned (Incorrect syntax near ‘.1’.)
I have commented out that line for now, but I might be missing something that is just as useful as the other columns referenced.
Once again thanks for gracefully planting so much.
Yeah – it was the code formatting plugin, where is a command to it. I removed the delimiters and it’s fine now.
I just went back and looked at Joe’s original post @ http://www.digitalconcourse.com/dropzone/MSCOMM/PASSMN/PASSEVT20090616/Joe%20Sack%20Performance%20Troubleshooting%20with%20Wait%20Stats.pdf.
And, I am a bit convinced that Joe’s erstwhile line read:
t.text
And, so [est].1 should probably read [est].text
Thanks,
Daniel
I blog a lot on LinkedIn. I’m always amazed that people aren’t using pluralsight.com. Paul has several courses on here that are stellar. His wait stats course is the only one like out there. He walks you through latches and spinlocks. You get to see the code and listen to insights. So, head on over to PS and watch his course and the many others by the sqlskills group. I don’t know Paul, never met him, not being paid for this… etc… but you won’t find more advanced tutorials anywhere.
If I have been taking waits snapshots every 15 minutes for a running 30 day window, and my application reports that it took sql server 2014 50 seconds to execute a query at 11:32 AM (between the stats), I should still expect to see some increase in the waits data at 11:45 AM, correct? If there is nothing significant, can I eliminate SQL Server as the problem in this scenario?
As long as you understand all the waits and what’s causing them, and as long as the application isn’t directly measuring how long SQL Server took to respond (as 50s), then yes.
I have saved this web page as a book mark – “The four horsemen of waits”
:-)