As part of the 2008 DBA class we’re teaching down here in Melbourne, I did a demo of using predicates and file targets with extended events, so I want to blog the script for people to play with.
For background info on extended events see:
-
My TechNet Magazine article from 2008: Advanced Troubleshooting with Extended Events
In this scenario, I’d like to track queries that make heavy usage of the CPU on my system.
First off I’ll create a test database to play with.
USE MASTER;
GO
IF DATABASEPROPERTYEX (‘production’, ‘Version’) > 0 DROP DATABASE production;
GOCREATE DATABASE production;
GO
USE production;
GOCREATE TABLE t1 (c1 INT IDENTITY, c2 UNIQUEIDENTIFIER ROWGUIDCOL DEFAULT NEWID(), c3 CHAR (5000) DEFAULT ‘a’);
CREATE CLUSTERED INDEX t1_CL ON t1 (c1);
CREATE NONCLUSTERED INDEX t1_NCL ON t1 (c2);
GOSET NOCOUNT ON;
INSERT INTO t1 DEFAULT VALUES;
GO 1000— Get the database ID to plug into the event session
SELECT DB_ID (‘production’);
GO
Notice that I grabbed the database ID of the new database I created, as I’ll need that when defining the extended event predicate.
IF EXISTS (SELECT * FROM sys.server_event_sessions WHERE name = ‘EE_ExpensiveQueries’)
DROP EVENT SESSION EE_ExpensiveQueries ON SERVER;
GOCREATE EVENT SESSION EE_ExpensiveQueries ON SERVER
ADD EVENT sqlserver.sql_statement_completed
(ACTION (sqlserver.sql_text, sqlserver.plan_handle)
WHERE sqlserver.database_id = 18 /*DBID*/ AND cpu_time > 10000 /*total ms of CPU time*/)
ADD TARGET package0.asynchronous_file_target
(SET FILENAME = N’C:\SQLskills\EE_ExpensiveQueries.xel’, METADATAFILE = N’C:\SQLskills\EE_ExpensiveQueries.xem’)
WITH (max_dispatch_latency = 1 seconds);
GO
I’m monitoring the event that fires whenever a statement completes, and I’m filtering by database ID (make sure you plug in the correct database ID when you try this yourself) and by the number of milliseconds of CPU time the statement used. Note: when using predicates you should always make sure that you order the predicate tests such that the most restrictive predicates (those most likely to evaluate to false) are first in the list, so the predicate evaluation ‘short-circuits’ as quickly as possible (a standard programming practice with boolean logic). I’m also using a file target, just to show how it can be done, instead of the ring buffer which is commonly used for extended events demos.
Now I’m going to turn on the event session and do some queries in the production database.
ALTER EVENT SESSION EE_ExpensiveQueries ON SERVER STATE = START;
GOUSE production;
GOSELECT COUNT (*) FROM t1 WHERE c1 > 500;
GOSELECT SUM (c1) FROM t1 WHERE c3 LIKE ‘a’;
GOALTER INDEX t1_CL ON t1 REORGANIZE;
GOALTER INDEX t1_CL ON t1 REBUILD;
GO
That should have generated some long-running queries. Now I’ll switch in to the context of master (so the querying of the event session itself doesn’t get captured by the event session) and see what I’ve captured.
USE master;
GOSELECT COUNT (*) FROM sys.fn_xe_file_target_read_file
(‘C:\SQLskills\EE_ExpensiveQueries*.xel’, ‘C:\SQLskills\EE_ExpensiveQueries*.xem’, NULL, NULL);
GO
In this case I’ve got 3 entries. I can pull these out using the following code:
SELECT data FROM
(SELECT CONVERT (XML, event_data) AS data FROM sys.fn_xe_file_target_read_file
(‘C:\SQLskills\EE_ExpensiveQueries*.xel’, ‘C:\SQLskills\EE_ExpensiveQueries*.xem’, NULL, NULL)
) entries;
GO
But I get three XML blobs back, like so:
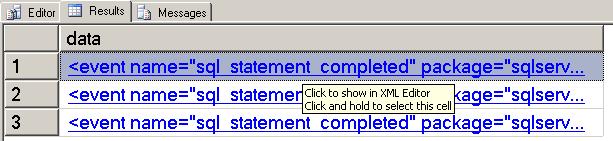
What’s more useful is to pull everything out of the XML blob programmatically using the code below:
SELECT
data.value (
‘(/event[@name=”sql_statement_completed”]/@timestamp)[1]’, ‘DATETIME’) AS [Time],
data.value (
‘(/event/data[@name=”cpu”]/value)[1]’, ‘INT’) AS [CPU (ms)],
CONVERT (FLOAT, data.value (‘(/event/data[@name=”duration”]/value)[1]’, ‘BIGINT’)) / 1000000
AS [Duration (s)],
data.value (
‘(/event/action[@name=”sql_text”]/value)[1]’, ‘VARCHAR(MAX)’) AS [SQL Statement],
‘0x’ + data.value (‘(/event/action[@name=”plan_handle”]/value)[1]’, ‘VARCHAR(100)’) AS [Plan Handle]
FROM
(SELECT CONVERT (XML, event_data) AS data FROM sys.fn_xe_file_target_read_file
(‘C:\SQLskills\EE_ExpensiveQueries*.xel’, ‘C:\SQLskills\EE_ExpensiveQueries*.xem’, null, null)
) entries
ORDER BY [Time] DESC;
GOTime CPU (ms) Duration (s) SQL Statement Plan Handle
———————– ——– ———— —————————————— ————————————————–
2009-10-16 17:59:29.623 30 1.214875 ALTER INDEX t1_CL ON t1 REBUILD; 0x06001000EB672A07B8C0C807000000000000000000000000
2009-10-16 17:59:28.407 20 0.024076 ALTER INDEX t1_CL ON t1 REORGANIZE; 0x0600100003594903B8C0C807000000000000000000000000
2009-10-16 17:59:28.343 51 0.045144 SELECT SUM (c1) FROM t1 WHERE c3 LIKE ‘a’; 0x06001000FAF5B11EB820C307000000000000000000000000
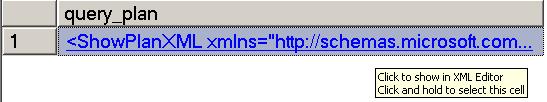
Now I can plug in one of the plan handles to a query of sys.dm_exec_query_plan to get the graphical query plan:
SELECT [query_plan] FROM sys.dm_exec_query_plan (0x06001000FAF5B11EB820C307000000000000000000000000);
GO
And clicking on the resulting XML ‘link’ gives the query plan:
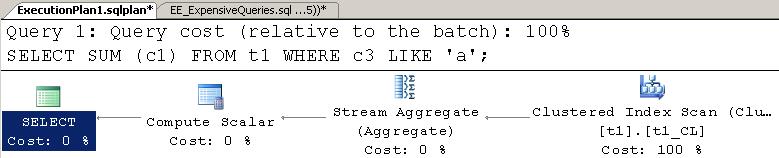
And now I can tweak the production workload to potentially behave better.
Just for kicks I went back into the context of the production database and ran the XML parsing again to capture the query plan – try it yourself – pretty gnarly! :-)
Now, if I was going to make this more useful, I’d use a ring buffer target, with a polling mechanism every few seconds to make sure that I can capture the graphical query plan for expensive queries before the plan is pushed out of cache – maybe I’ll get around to doing that and publish the complete solution.
In the meantime, here’s a zip file containing the entire script that you can download and play with: EE_ExpensiveQueries.zip (1.72 kb)
Enjoy!
6 thoughts on “Tracking expensive queries with extended events in SQL 2008”
Paul,
The ring_buffer target would have to be restricted on its memory size to try and avoid a potentially problemattic bug associated with it. There is a connect item for the bug (http://connect.microsoft.com/SQLServer/feedback/ViewFeedback.aspx?FeedbackID=432548), but the serialization to XML can overrun the amount of data that can be shown in the DMV, the limit is 4MB, causing a malformed XML Document that you won’t be able to parse with XQuery in TSQL. Bob Ward wrote about it on the PSS blog recently (http://blogs.msdn.com/psssql/archive/2009/09/17/you-may-not-see-the-data-you-expect-in-extended-event-ring-buffer-targets.aspx). I wrote a handler in the Extended Events SSMS Addin that handles this and removes the invalid XElement from the XDocument when I parse it, but you still lose fired events when this happens.
The ring_buffer is also much slower to query when it has a lot of data in it. It can take minutes to get the information with XQuery from the ring_buffer in some cases where it takes seconds against the file target, and it uses VAS while doing this which can be a problem on VAS limited 32 bit servers.
Just some things to keep in mind.
You seem to have forgotten Chapter 2 in "SQL Server 2008 Internals" :-)
I would like to create this on my system for queries running longer than 30 Seconds. Do you recommend running Extended Events for sqlserver.sql_statement_starting and sqlserver.sql_statement_Completed continuously in an OLTP system>
No need to track statement_started. It shouldn’t cause a perf issue on a well-performing system.
Could you please explain why we need substring to retrieve the correct plan here?
SUBSTRING (data.value (‘(/event/action[@name=”plan_handle”]/value)[1]’, ‘VARCHAR(100)’), 15, 50)
You don’t any longer. That’s an old post and the XML format of the events has changed since SQL Server 2008. I’ve updated the code to work on recent versions.