It’s been a long time since the last blog post on SSD benchmarking – I’ve been busy! I’m starting up my benchmarking activities again and hope to post more frequently. You can see the whole progression of benchmarking posts here.
You can see my benchmarking hardware setup here, with the addition of the Fusion-io ioDrive Duo 640GB drives that Fusion-io were nice enough to lend me. My test systems now have 16GB each and all tests were performed with the buffer pool ramped up, so memory allocation didn’t figure into the performance numbers.
In this recent set of tests I wanted to explore three questions:
Check It Out!

-
What kind of performance gain do I get upgrading from Fusion-io’s v1.2 driver to the v2.2 driver?
-
What is the sweet spot for the number of files on an SSD?
-
Does a 4Kb block size give any gains in performance for my test?
To keep it simple I’m using one half of the 640GB drive (it’s two 320GB drives under the covers). To do this my test harness does the following:
- Formats the SSDs in one of three ways:
- Fusion-io basic format (the 320GB drive has 300GB capacity)
- Fusion-io improved write performance format (the 320GB drive has only 210GB capacity, 70% of normal)
- Fusion-io maximum write performance format (the 320GB drive has only 151GB capacity, 50% of normal)
- The SSD format is performed using Fusion-io’s ioManager tool
- Creates 1, 2, 4, 8, 16, 32, 64 or 128 data files, with the file sizes calculated to fill the SSDs
- My table structure is:
CREATE TABLE MyBigTable (
c1 UNIQUEIDENTIFIER ROWGUIDCOL DEFAULT NEWID (),
c2 DATETIME DEFAULT GETDATE (),
c3 CHAR (111) DEFAULT ‘a’,
c4 INT DEFAULT 1,
c5 INT DEFAULT 2,
c6 BIGINT DEFAULT 42);
GOCREATE CLUSTERED INDEX MyBigTable_cl ON MyBigTable (c1);
GO
-
I have 64 connections each inserting 2.5 million records into the table (with the loop code running server-side) for a total of 160 million records inserted, in batches of 1000 records per transaction. This works out to be about 37 GB of allocated space from the database.
The clustered index on a random GUID is the easiest way to generate random reads and writes, and is a very common design pattern out in the field (even though it performs poorly) – for my purposes it’s perfect.
I tested each of the eight data file layouts on the following configurations (all using 1MB partition offsets, 64k NTFS allocation unit size, RAID was not involved):
-
Log and data on a single 320GB SSD with the old v1.2.7 Fusion-io driver (each of the 3 ways of formatting)
-
Log and data on a single 320GB SSD with the new v2.2.3 Fusion-io driver (each of the 3 ways of formatting)
-
Log and data on a single 320GB SSD with the new v2.2.3 Fusion-io driver and a 4Kb block size (each of the 3 ways of formatting)
The test harness takes care of all of this except reformatting the drives, and also captures the wait stats for each test, making note of the most prevalent waits that make up the top 95% of all waits during the test. This uses the script from this blog post.
On to the results… the wait stats are *really* interesting!
Note: the y-axes in the graphs below do not start at zero. All the graphs have the same axes so there is nothing to misunderstand. They are not misleading – and I make no apologies for my choice of axes – I want to show the difference between the various formats more clearly.
v1.2.7 Fusion-io driver and 512-byte sector size
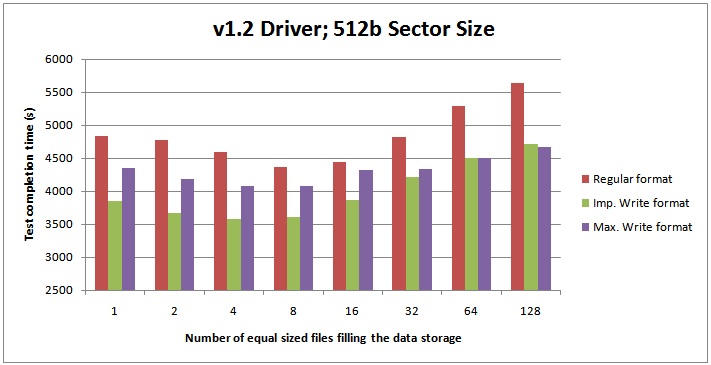
The best performance I could get with the old driver was 3580 seconds for test completion, with 4 data files and the Improved Write format – a tiny amount less than the time for 8 data files.
v2.2.3 Fusion-io driver and 512-byte sector size
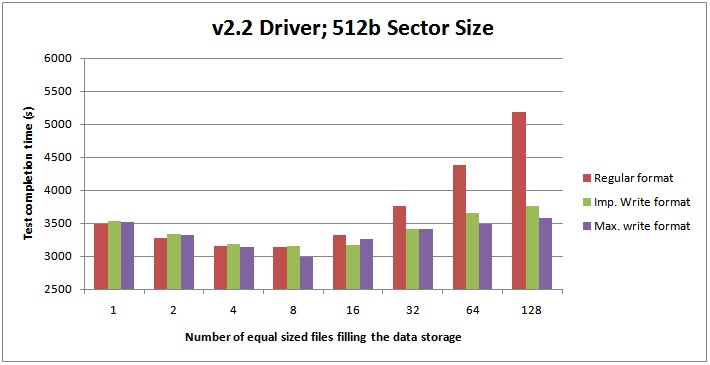
The best performance I could get with the new driver was 2993 seconds for test completion, with 8 data files and the Max Write format – a tiny amount less than the time for other formats for 8 data files, and very close to the times for 4 data files.
On average across all the tests the new v2.2 Fusion-io driver gives a 20.5% performance boost over the old v1.2 driver, and for the regular format, the new v2.2 Fusion-io driver gives a 24% performance boost over the old v1.2 driver. It also (but I didn’t measure) reduces the amount of system memory required to use the SSDs. Good stuff!
v2.2.3 Fusion-io driver and 4-Kb sector size
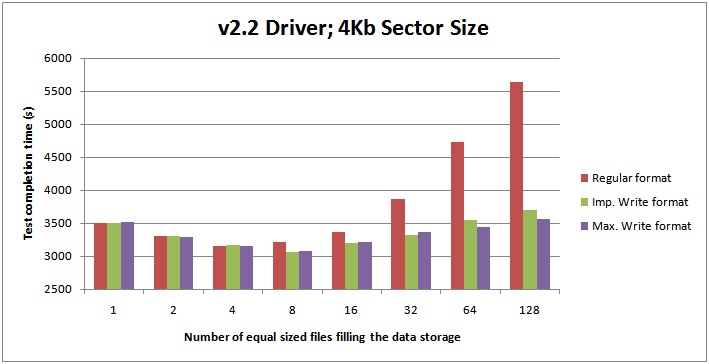
The performance using a 4-Kb sector size is roughly the same for my test compared to traditional 512-byte sector size. The most performance gain I got was 3% over using a 512-byte sector size, but on average across all tests the performance was very slightly (0.5%) lower.
Wait Stats
The wait stats were very interesting.
The wait stats are presented in the following format:
WaitType Wait_S Resource_S Signal_S WaitCount Percentage AvgWait_S AvgRes_S AvgSig_S
————– ——— ———- ——– ——— ———- ——— ——– ——–
PAGEIOLATCH_EX 154611.39 128056.51 26554.88 45295507 71.83 0.0034 0.0028 0.0006
PAGELATCH_UP 37948.31 36988.52 959.79 2314370 17.63 0.0164 0.016 0.0004
PAGELATCH_SH 16976 13823.71 3152.3 3751811 7.89 0.0045 0.0037 0.0008
The columns are:
- WaitType – kind of obvious
- Wait_S – cumulative wait time in seconds, from a thread being RUNNING, going through SUSPENDED, back to RUNNABLE and then RUNNING again
- Resource_S – cumulative wait time in seconds while a thread was SUSPENDED (called the resource wait time)
- Signal_S – cumulative wait time in seconds while a thread was RUNNABLE (i.e. after being signalled that the resource wait has ended and waiting on the runnable queue to get the CPU again – called the signal wait time)
- WaitCount – number of waits of this type during the test
- Percentage – percentage of all waits during the test that had this type
- AvgWait_S – average cumulative wait time in seconds
- AvgRes_S – average resource wait time in seconds
- AvgSig_S – average signal wait time in seconds
For a single file, the wait stats for all the various formatting options look like:
WaitType Wait_S Resource_S Signal_S WaitCount Percentage AvgWait_S AvgRes_S AvgSig_S
————– ——— ———- ——– ——— ———- ——— ——– ——–
PAGEIOLATCH_EX 226362.54 193378.56 32983.98 45742117 78.66 0.0049 0.0042 0.0007
PAGELATCH_UP 36701.66 35760.67 940.99 2144533 12.75 0.0171 0.0167 0.0004
PAGELATCH_SH 16775.05 13644.99 3130.06 3542549 5.83 0.0047 0.0039 0.0009
With more files, the percentage of PAGEIOLATCH_EX waits increases, and by the time we get to 8 files, SOS_SCHEDULER_YIELD has started to appear. At 8 files, the wait stats for all the various formatting options look like:
WaitType Wait_S Resource_S Signal_S WaitCount Percentage AvgWait_S AvgRes_S AvgSig_S
——————- ——— ———- ——– ——— ———- ——— ——– ——–
PAGEIOLATCH_EX 244703.77 210859.63 33844.14 45169863 89.47 0.0054 0.0047 0.0007
SOS_SCHEDULER_YIELD 12500.15 0.99 12499.16 823658 4.57 0.0152 0 0.0152
PAGELATCH_SH 5777.54 3749.18 2028.36 476618 2.11 0.0121 0.0079 0.0043
By 16 files, the PAGELATCH waits have disappeared from the top 95%. As the number of files increases to 128, the PAGEIOLATCH_EX waits increase to just over 91% and the wait stats look like this for regular format:
WaitType Wait_S Resource_S Signal_S WaitCount Percentage AvgWait_S AvgRes_S AvgSig_S
——————- ——— ———- ——– ——— ———- ——— ——– ——–
PAGEIOLATCH_EX 304106.32 273671 30435.32 43478489 91.25 0.007 0.0063 0.0007
SOS_SCHEDULER_YIELD 16733 1.35 16731.65 889147 5.02 0.0188 0 0.0188
What does this mean? It’s obvious from the wait stats that as I increase the number of data files on the drive, the average resource wait time for each PAGEIOLATCH_EX wait increases from 4.2ms for 1 file up to 6.3ms for 128 files – 50% worse, with the signal wait time static at 0.7ms.
But look at the wait stats for 128 files using the Maximum Write format:
WaitType Wait_S Resource_S Signal_s WaitCount Percentage AvgWait_S AvgRes_S AvgSig_S
——————- ——— ———- ——– ——— ———- ——— ——– ——–
PAGEIOLATCH_EX 196322.97 166602.88 29720.09 45435521 88.66 0.0043 0.0037 0.0007
SOS_SCHEDULER_YIELD 16182.48 1.1 16181.38 828595 7.31 0.0195 0 0.0195
The average resource wait time for the PAGEIOLATCH_EX waits has dropped from 6.3ms to 3.7ms! But isn’t PAGEIOLATCH_EX a wait type that’s for a page *read*? Well, yes, but what I think is happening is that the buffer pool is having to force pages out to disk to make space for the pages being read in to be inserted into (which I believe is included in the PAGEIOLATCH_EX wait time) – and when the SSD is formatted with the improved write algorithm, this is faster and so the PAGEIOLATCH_EX resource wait time decreases.
But why the gradual decrease in PAGELATCH waits and increase in SOS_SCHEDULER_YIELD waits as the number of files increases?
I went back and ran a single file test and used the sys.dm_os_waiting_tasks DMV (see this blog post) to see what the various threads are waiting for. Here’s some example output:
session_id wait_duration_ms wait_type resource_description
———- —————- ———— ——————–
79 11 PAGELATCH_UP 5:1:1520544
80 14 PAGELATCH_UP 5:1:1520544
93 16 PAGELATCH_UP 5:1:1520544
94 0 PAGELATCH_UP 5:1:1520544
101 15 PAGELATCH_UP 5:1:1520544
111 25 PAGELATCH_UP 5:1:1520544
110 17 PAGELATCH_UP 5:1:1520544
75 6 PAGELATCH_UP 5:1:1520544
78 17 PAGELATCH_UP 5:1:1520544
88 8 PAGELATCH_UP 5:1:1520544
107 12 PAGELATCH_UP 5:1:1520544
109 25 PAGELATCH_UP 5:1:1520544
113 20 PAGELATCH_UP 5:1:1520544
.
.
Dividing 1520544 by 8088 gives exactly 188. Running the same query a few seconds later gives most of the threads waiting on resource 5:1:1544808, another exact multiple of 8088. These resources are PFS pages! What we’re seeing is PFS page contention, just like you can get in tempdb with lots of concurrent threads creating and dropping temp tables. In this case, I have 64 concurrent threads doing inserts that are causing page splits, which requires page allocations. As the number of files increases, the amount of PFS page contention decreases. It disappears after 8 files because I’ve only got 8 cores, so there can only be 8 threads running at once (one per SQLOS scheduler, with the others SUSPENDED on the waiter list or waiting in the RUNNABLE queue).
From 16 to 128 files, the wait stats hardly change and the performance (in the Improved Write and Max Write formats) only slightly degrades (5%) with each doubling of the number of files. Without deeper investigation, I’m putting this down to increased amounts of metadata to deal with – maybe with more to do when searching the allocation cache for the allocation unit of the clustered index. If I have time I’ll dig in and investigate exactly why.
The SOS_SCHEDULER_YIELD waits are just because the threads are able to do more before having to wait, and so they’re hitting voluntary yield points in the code – the workload is becoming more CPU bound.
Summary
I’ve clearly shown that the new Fusion-io driver gives a nice boost compared to the older one – very cool.
I’ve also shown that the number of files on the SSD does have an affect on performance too – with the sweet spot appearing to be the number of processor cores (just an observation, definitely NOT a recommendation). I’d love to see someone do similar tests on a 16-way, 32-way or higher (or lend me one to play with :-)
[Edit: I discussed the results with my friend Thomas Kejser on the SQLCAT team and he sees the same behavior on a 64-way running the same benchmark (in fact we screen-shared on a 64-way system with 2TB and 4 640GB Fusion-io cards this weekend). He posted some more investigations on his blog – see here.]
And finally, I showed that for my workload, using a 4-Kb sector size did not improve performance.
I’d call that a successful test – *really* interesting!
24 thoughts on “Benchmarking: Multiple data files on SSDs (plus the latest Fusion-io driver)”
Very interesting. We use RAM drives on some of our servers for tempdb and full-text catalogues; I wonder if there’d be any similarity between that and your FusionIO findings regarding the number of database files? Time to test it I guess. :-)
Hey Dave – I don’t see why not as the principal is the same – especially as Fusion-io drives are server-side rather than attached through some network fabric. I’d love to hear of your results if you get time to do any testing!
Very interesting results Paul! Thanks for taking the time to put this together and share your findings with us.
Would like to see this with increasing number of DBs. i.e. if you have 24 DBs all on a single FIO card what is the impact compared to running one.
Paul,
Your update is very timely as we are about to purchase Fusion-IO cards to offload tempdb storage from our SAN. I was debating the benefit using a larger sector size and your benchmark numbers help very much.
Paul – reading some white papers on this type of storage, a concern seems to be deterioration of performance as they fill up with with data (i.e. slower writes to a full card than an empty one.) I wonder if that type of test is in your plans – maybe run a test to data files that fill 1/2 an empty card, then a test to fill a card from 50% to 99%? Also wonder if you would like another vendor’s cards for comparison, or if that’s less interesting :-)
Hi again Paul. I’ll definitely post the results of the RamDisk comparison. We did have some eval FusionIO’s recently, but have since given them back (bugger!). But we do have a nice new EMC V-Max SAN with plenty of solid state & FC disk, so I’m going to do some comparisons between that (solid state & FC) and the RamDisk. I was wondering if you could give me a little more info on your test rig? For example, are you using some kind of load tool to spin up the 64 connections? Sorry if you’ve given this detail somewhere else; I searched but couldnt find it. Thanks.
Hey Paul, do you think you could have improved performance if SQL Server had a flash cache capability, similar to Oracle?
Also, this test seems to have been fully cached (?) would your answer change if the test DB were much larger than the cache?
Merrill, filling up a flash based SSD in a high i/o scenario basically equates to mis-use of the device.
Data cannot be over-written in place in flash memory & hence is relocated somewhere else upon every write (at block scope). If you fill up the device, there’s nowhere for this relocation to occur & writes then have to wait on previously used blocks to be "flashed" (zero’d, ready for new writes), hence "over-provisioning" is required with flash based SSDs. The higher your i/o rate, the more you have to "over provision" (smaller File System allocation vs device capacity, or in other words, the device is "over provisioned" against the FS allocation).
We provision SSDs by default for SQL Server with 25% over-provision (FS = 75% of device capacity) and sometimes go lower (eg 50%) in extreme i/o scenarios. As a result, we’ve never seen device degradation after years of use in high volume sites. If you didn’t over-provision however, you could expect the degradation you’ve described but this just means the device wasn’t correctly specified.
Hi Dave – it’s very simple – just a CMD file that spawns 64 CMDs each of which run a SQLCMD script that connects to the server and does the work serverside. Cheers
Dave – check out the first post in the series – https://www.sqlskills.com/blogs/paul/post/Benchmarking-1-TB-table-population-(part-1).aspx
Texas Memory says give them a shout and they might be able to hook you up with some of their similar PCI-E cards (if available). Seems like the comparison could be really interesting.
Hi Paul
This matches my experiences. As you grow into the very high scale, you end up with #data files = #cores.
I happen to have a 64 core box around with some FusionIO. If you could mail me the exact test harness you run (just 64 x SQLCMD?), I will try to run your tests on the bigger box.
Another insight Paul: The reason you see lower latency on PAGEIOLATCH at 128 could be caused by the characteristics of the Fusion cards. A wide I/O pattern with few outstanding IOPS on each thread is more efficent on NAND than a narrow pattern with many outstanding on each thread.
@Merrill I do have more tests planned, including one of those. And I’m always open to playing with more hardware :-)
@Thomas Cool – that it matches your high-scale experience. And will drop you a mail.
@Thomas2 Very interesting.
@Greg Test wasn’t fully cached as the box only has 16GB and I was inserting 37GB of new data with a random GUID key. Perf would have been better with more memory (i.e. more cache) for sure.
@Paul: by the way, if my theory about the low latency in 128 file scenario is true, you should see lower disk queue lengths per thread during that run.
For my test, I will just run with the latest FusionIO driver on a write optimized drive. I think you have proven the point about drivers and write optimization well enough already.
With regards to the SOS_SCHEDULER_YIELD waits, what does your CPU look like during the 128 file run?
@Thomas Just re-ran the 128 file tests – all 8 non-HT cores sitting at 70-80% usage.
I had a RamSAN at my last company and compared it to my Fusion-IO drives I had locally. I didn’t run the same tests like Paul just a standard IOStats set for each of the drives. Basically what I found is that the RamSAN could do the same numbers but was limited by whatever network pipe you were connecting to with it. In our case a 4GB fiber. Unless you can get a network pipe to it that can get you faster speed I think it will be the deciding factor on the performance you get. :)
Paul, Great tests/results looking forward to many more. :)
@Paul: I would look at spinlocks at this point. If you are getting SOS_SCHEDULER_YIELD, I would expect some contention that is measurable there
Would love to see this updated with 2012 R2 and SQL 2014 SP1.
Shouldn’t be any significant difference.
Hi Paul,
In your DB Engine blog you mention: “Free space is only tracked for pages storing LOB values and heap data pages. This is because these are the only pages that store unordered data and so insertions can occur anywhere there’s space. For indexes, there’s an explicit ordering so there’s no choice in the insertion point.”
Given this and your test table here has clustered index on MyBigTable(c1), why are we seeing PFS page contention? Can you please help me understand? Thanks!
Because PFS pages track the allocation state of all pages, as I describe on that blog here: https://blogs.msdn.microsoft.com/sqlserverstorageengine/2006/07/08/under-the-covers-gam-sgam-and-pfs-pages/
Hi Paul,
As always , You are Superb !!!!!